Are you tired of hammering out the same commands over and over again in GDB? If not, we highly encourage you take more advantage of The GNU Project Debugger, which is a fantastic way to poke around inside your microcontrollers while they’re running a program.
Back to the matter at hand. [Stef] put together a Python program that leverages GDB’s Remote Serial Protocol. He calls it pyrsp and the talk he recently gave about it can be seen below.
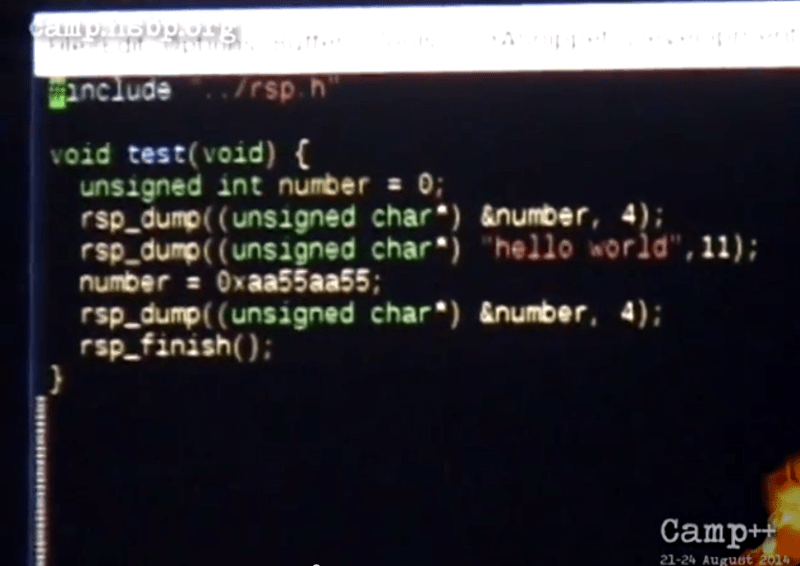
The core feature is the ability to add a callback in your C code that triggers the Python script. Think of this a little bit like a print statement, except you have so much more power since it’s Python and GDB doing the “printing”. Anything that can be done at a breakpoint in GDB can now be executed automatically. So if you need to check a group of registers at every loop execution for hundreds of loops your wrists are going to thank you. Better yet, you can use Python to do the sanity checks automatically, continuing when the data is good and alerting you when it’s not. Neat!


Wow Mike, this must be fantastic because it helped you debug your time sensitive loops right?
visualgdb+visual studio
But why?
If you haven’t actually done debugging with a commercial IDE, you owe yourself to do that at least once. If you are living in the text adventure world of debugger, at least try even a open source IDE that have a gdb plug-in.
I am playing with Keil MDK (32kB code+data limit) demo and I like the fact that I can bring up a peripheral window that show annotated register bits of the current updated values during a debugging mode with explanation what each of the setting means at a glance. And you can change them too by clicking, Imagine that! That’s really useful when you are writing drivers (which I am doing). Just being able to pull up the nVIC or SIM window to find out if you have pending interrupts or if you forgot to turn on the gated clock for a peripheral or if you used the wrong bit setting is a god sent. Your drive that this point is at hard fault or interrupt, so the usual print statement is useless (or that you don’t want to recompile to add one). I found the wrong definition in the head file of an open source project. Always nice to have a second source for checking.
I am aware that there is an eclipse plug in for something similar, but they have less than 10 ARM chips in total and all from the same family last time I looked. A paid product would have the resource (and NDA and early access to vendor data) to support parts that you are likely to use and not just what the open source developer happens to have on hand. You also don’t want to be the same person that debug the plug-in when you are debugging a new hardware.
There is also options to use SWO for gathering stats on the ARM core on exceptions and snapshot of where the core is at. Obviously the cores are running at much faster speed than the bandwidth of the SWO serial stream can gather. But even real time snap shots at regular intervals can tell you where your code is at.
Thank you for this explanation
yeah agreed. for time-sensitve/real-time applications pyrsp might be too slow. But over simple JTAG you don’t debug those anyway, you use usually some more advanced HW based debugging, no? anyway it was still useful for me since i wasn’t having real-time requirements. also it’s still useful to do unit testing, on-device fuzzing and general reversing as well.
I guess I came across as snarky for two reasons: I don’t think Mike has ever touched pyrsp and yet he is gushing and BSing about how great it is. The second reason is that I just bumbled for a week getting a linux kernel up and running and looking back, perhaps something like pyrsp would have helped.
I was experiencing errors with clock frequencies getting set to bad values, bad device tree, faults from peripherals not initializing and all sorts of bad stuff (including my Jlink not reading DDR sometimes). Code was relocating to all sorts of crazy offsets from the vmlinux. I resorted to halting at infinite loops as breakpoints as those were the only reliable places to stop.
How would pyrsp work for kernel dev?
>he is gushing and BSing about how great it is.
The copy here is pretty awful a lot of the time. To make “hacks” seem hip and cool they write a ton of crap copy that contains typos etc and often doesn’t actually make sense or relate to the hack in question at all. Just look for the first link in the body of the article and go direct to the source.
>How would pyrsp work for kernel dev?
If you can get the kernel to get far enough you can use the built in GDB server to remotely debug it. A decent hardware level debugger should be enough to help you find fundamental issues that are stopping even stuff like early printk from working.
>Code was relocating to all sorts of crazy offsets from the vmlinux.
Why would kernel code be relocating? If it’s at the point where it’s loading modules then it’s almost fully working.
not every microcontroller out there would have extra resources to put in a gdb… So while that might works for linux, it doesn’t work for micrcontrollers running other RTOS or bare metal.
This is cool, but I hope you know that you can write your own functions inside gdb too… so I would not say that you have to give a lots of command over n over again… only if you not aware of scripting your repeated tasks…. :)