A lot of hardware and software hackers aren’t all that keen on documentation. The problem is, if you don’t document, it is harder for people to replicate or build on your work. If you aren’t happy writing, keep the old adage in mind: a picture is worth a thousand words.
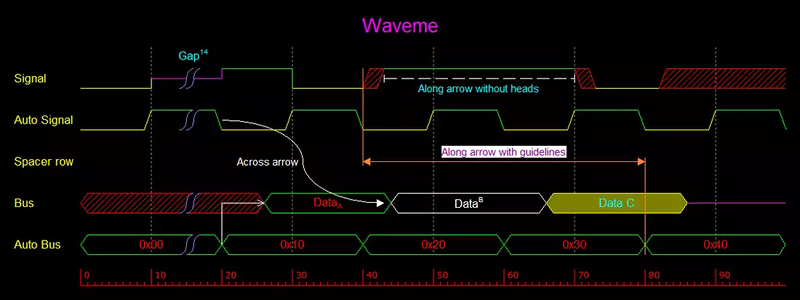
With a digital design, a timing diagram is often a key piece of documentation. WaveMe is a free Windows program that makes it easy to create good-looking timing diagrams. You can run the software on other platforms via Wine.
The software can handle signals and busses. It also allows rulers, labels, and other items you’d expect in a tool like this. Of course, you could draw diagrams using any drawing tool, but using something that specifically knows about timing diagrams makes it a lot easier.
If you prefer a more text-based approach, check out Wavedrom (or one of the other similar fonts like XWave, mentioned in the same post). If you’d rather make real waves instead of pictures, you could try making a waveform generator.


It would be nice to have a piece of software working in reverse way – generating functions on diagram base ;)
That is actually not a bad idea…will get working on something like this (i have a vague idea on how this could be done), once my current project is over. Of course that would probably mean drawing the diagram in the said piece of software, otherwise it is prone to the typical failures image recognition software has (which i am pretty sure would ruin you day in the best case, and ruin equipment in the worst case).
Head start? http://www.codeproject.com/Articles/31935/Draw-into-sound
I use this for extracting weird curves from datasheets and images: http://arohatgi.info/WebPlotDigitizer/
i think windows defender is giving a false positive.. its tagged it as a virus
Uh…. that level of detection isn’t good. I wonder what’s triggering the scanners: https://virustotal.com/en/file/1d56b1d8786ced2b5021818e18db531289703e66cccca226ef455aa9406934bc/analysis/1478565381/
It’s the UPX packer. For some anti-virus tools, anything packed with UPX is suspicious by default.
Which Windows version, and what is the exact message you get?
im at windows 7.. it just says virus detected
While I think it’s good that people are looking for software like this, I still think this is not much better than wavedrom. Perhaps it’s even worse because every transition of every wave has to me micro manages in it’s own dialog box.
This is a rendering engine with less calculation ability than an abacus. I do this sort of thing in JavaScript and html 4. at least then I can enter some meaningful parameters for calculations.
Electronic timing charts are not about frequencies or periods, there about delays. You need to be able to enter delays so that you can enter a clock speed and see what everything looks like and then vary *nothing* except the clock speed and see if it still works.
I don’t think engineers are poor at documenting this sort of thing. It’s the poor quality of the available tolls that is the issue.
What we need is something where you define the parameters / delays and it creates a scope like interface (perhaps web based) so the the viewer can alter the time base and other scope like controls to explode the signal.
Java would be the choice that is easiest on the client machine but not everyone enables Java in their browser so the second best option is probably JavaScript and HTML 5 (or flash).
Before anyone suggest that I get off my ass and write the JavaScript / HTML 5 … I haven’t yet learnt HTML 5 and that is why I do it on HTML 3 / 4. Apart from that I am not really a good JavaScript writer … My JavaScript will break on every browser except the on I used to debug it.
Problem is that some aren’t good at pictures either.
the irony is that this is actually a python program but it has an interpreter and DLLs bundled with it and all balled into a windows executable. the author seems to abhor open source.
I don’t know of any other way to conveniently distribute a program written in Python, but to convert it into an executable.
And, the author has nothing against open source…
Often times, I will write waveform simulations in Python, and either export the data as CSV to visualize in Excel, or interface with matplotlib, which is also easy to work with. Performing unit testing and visualizing algorithms is super handy for finding logic bugs before executing the code in situ. The nice thing about this simulation approach is that it’s possible to test your actual algorithm, rather than simple timing diagrams to validate your design assumptions.
Thank you Al for reviewing my software, and all for your comments.
I designed this tool with people like me in mind –
those who need to include a timing diagram in a document they write,
or draw one to communicate with other hardware circuit and chip designers.
I prefer a GUI-based interactive tool over a text-entry tool like Wavedrom.
I attempted to make drawing fast and accurate, with plenty of customization where I think it counts,
while helping the user maintain the overall looks of a diagram.
I thought that distributing Waveme as a single executable file will be the easiest, for me and the users.
Using UPX compression reduces the file size by 30%. Otherwise, I won’t be able to load it into my free weebly account.
It is unfortunate that some antivirus programs flag the file, and that’s why I point to Google’s virustotal.
Thank you again for taking the time to review Waveme,
and please help make Waveme even more useful by providing your feedback on Waveme’s Google group.