How do you test the oscillator circuit you just made that runs between 200MHz and 380MHz if all you have is a 100MHz oscilloscope, a few multimeters and a DC power supply? One answer is to put away the oscilloscope and use the rest along with a length of wire instead. Form the wire into a Lecher line.
That’s just what I did when I wanted to test my oscillator circuit based around the Mini-Circuits POS-400+ voltage controlled oscillator chip (PDF). I wasn’t going for precision, just verification that the chip works and that my circuit can adjust the frequency. And as you’ll see below, I got a fairly linear graph relating the control voltages to different frequencies.
What follows is a bit about Lecher lines, how I did it, and the results.
What’s A Lecher Line?
A Lecher line consists of two parallel wires or rods that form a balanced transmission line. The technique results in a way to physically measure wavelengths. This method has been around for a long time. Its namesake is Ernst Lecher, a physicist from Austria who perfected the practice in 1888.
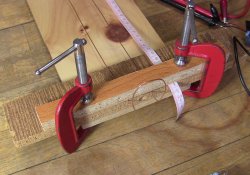
The length should be some multiple of the oscillator’s output wavelength. The oscillator’s waves are applied to one end of the Lecher line where the two wires are connected together, forming a loop in my setup. Also in my setup the other end of the line is open, the wires are not connected together there.
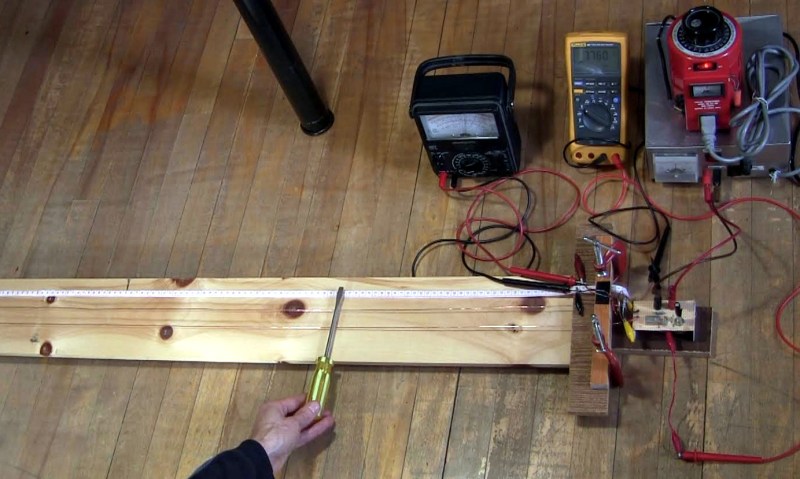
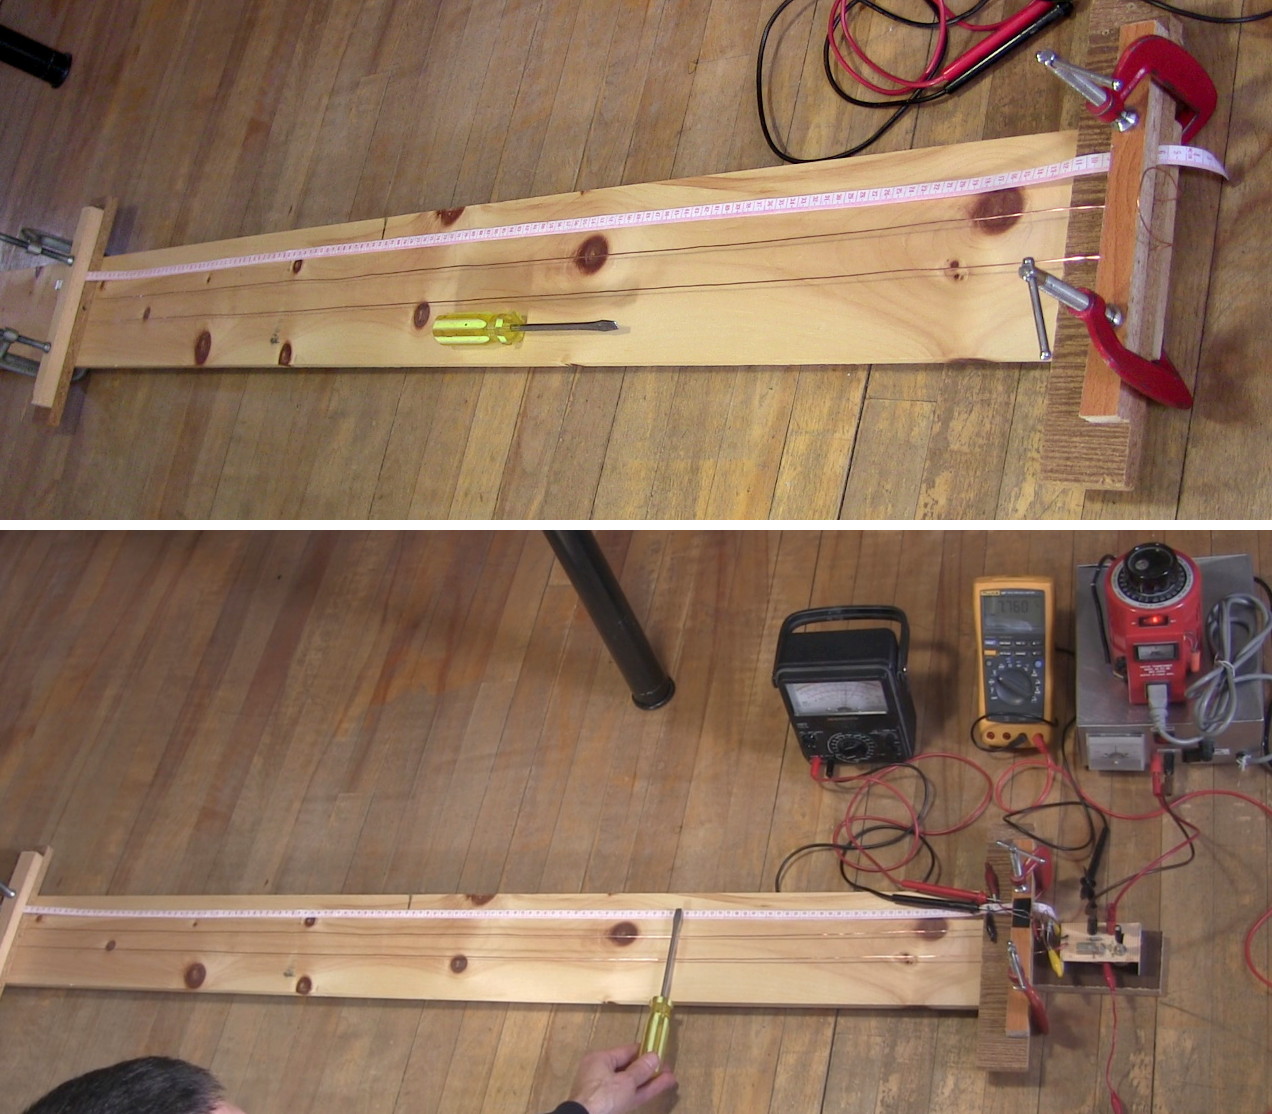
A metal bar, or a screwdriver in my case, is put across the width of the two parallel wires, shorting them. As I slide the bar along the wires, it influences the waves. When the bar reaches the wave’s nodes, positions along the wires that are at a half or full wavelength (the zero crossing locations), it can be detected in various ways. One of those ways is to have the bar be two terminals of a neon bulb. The bulb goes out at the nodes, where the voltage is zero. But I didn’t have a neon bulb so I’ll show another way below.
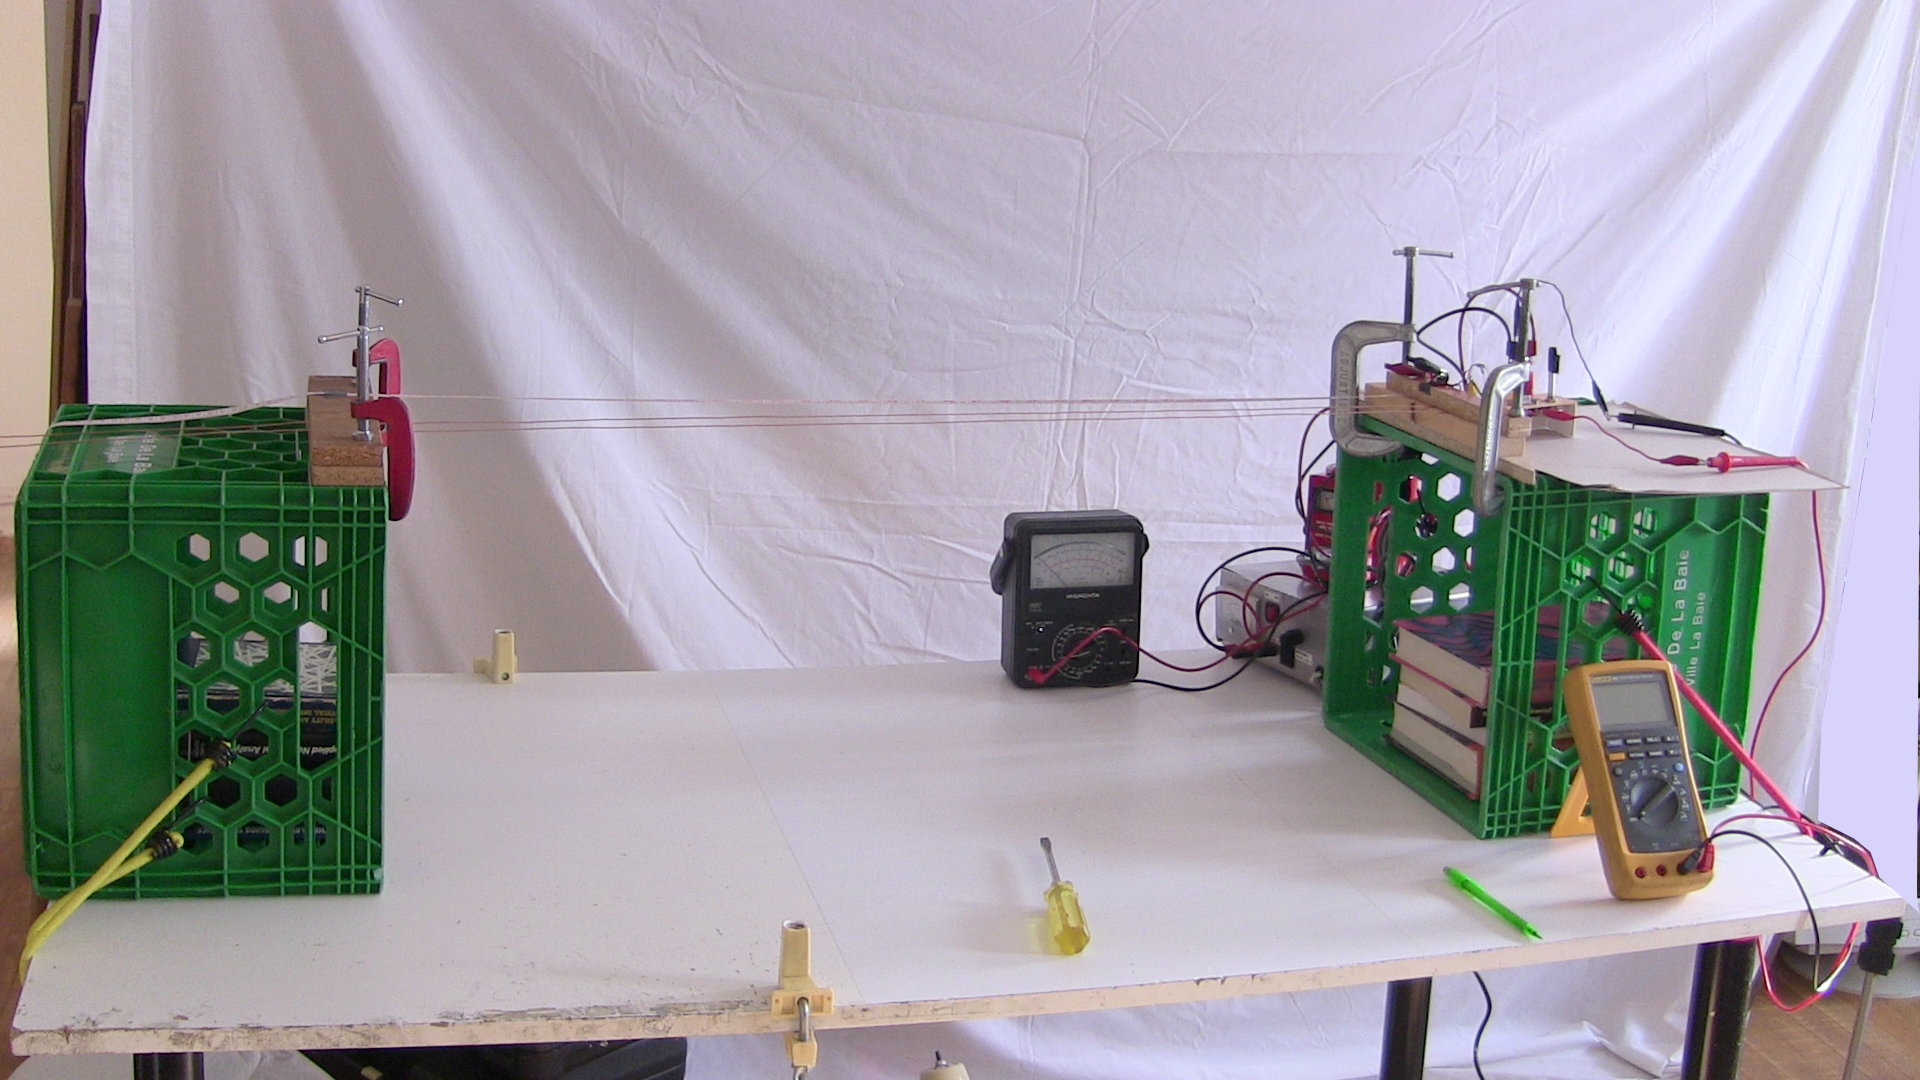
In the photos you can see a measuring tape running the length of the wires for measuring the distance from the end of the Lecher line to the nodes. By doing so, you’re measuring the wavelength of the waves and can use that to calculate the frequency.
The distance between the wires should be even and should be significantly smaller than the length of the wavelength being measured.
My Setup
Since my oscillator can produce between 200MHz and 380MHz, I needed a Lecher line that was long enough to accommodate that range. The formula for converting frequency to wavelength where electromagnetic waves are concerned is:
wavelength = speed_of_light / frequency
which gives:
300,000,000 m/s / 200,000,000 cycles/second = 1.5 m
300,000,000 m/s / 380,000,000 cycles/second = 0.79 m
I made mine 1.5 meters long.


To test the oscillator circuit, I formed a loop at the oscillator’s output that matched the loop at the end of the Lecher line. Part of that loop is a 6.8 Kohm resistor, there so that the oscillator circuit wouldn’t see a dead short. To apply the circuit’s waveform to the Lecher line, I simply put the oscillator’s loop very near to that of the Lecher line. i.e. The oscillator puts electromagnetic waves on the Lecher line using induction. In the first photo above, the oscillator is pulled back a bit to make things clearer.


The next step was to detect when the screwdriver was at a node on the Lecher line. For that I used a high frequency diode, an NTE583 silicon diode whose packaging says “Schottky Switching for High Level UHF/VHF Detection and Pulse Application”. I soldered wires to either end and formed a loop. As shown in the above photos, I added the diode loop to the collection of loops at the end of the Lecher line.
The diode’s two wires go to an analog meter set to the 1-volt scale. When the screwdriver is still less than half a meter from the oscillator end, and at the node for the first half-wavelength, the voltage across the diode is above 0.5 volts. When the screwdriver is between nodes, the voltage is less than 0.1 volts. But the further the nodes are from the oscillator, the lower the voltage is on the meter, until the meter’s needle barely deflects at all.
Results
The node closest to the oscillator end of the Lecher line is a half wavelength. The next one further away is a full wavelength. When the screwdriver is at a location that causes a voltage peak on the analog meter, you’ve found a node and the distance from the oscillator end to that node is recorded.
The oscillator is a voltage controlled oscillator. My circuit includes a voltage divider and potentiometer for adjusting that voltage, which controls the oscillator’s output frequency. The yellow Fluke digital meter is there to show the control voltage. That’s recorded along with the distance measurement.
The oscillator’s control voltage is then turned up, increasing the frequency and decreasing the wavelength. The new distance and control voltage measurements are then recorded.
That’s repeated for the oscillator’s full 0 to 12 volt range of control voltages. The resulting data and graph are shown below.
The frequency is derived from the data using this formula:
frequency = 300,000,000 m/s / (2 * half-wavelength measurement)
The half-wavelength measurement (the 1/2 wavelength column in the table) is multiplied by 2 rather than using the full-wavelength measurement (the 1 wavelength column). That’s because, as was mentioned above, the further the screwdriver was from the oscillator’s end of the Lecher line, the lower the voltage was on the analog meter to the point where there was hardly any deflection at all.


Looking for more high frequency measuring projects here on Hackaday? There’s one using 74-logic for a DIY 100MHz frequency counter, an inexpensive timebase add-on for HP 53131 10MHz frequency counter that [Gerry] built instead of buying the stock $1000 one, and a project that started as a sub-project, the Nanocounter, built with an FPGA, STM32F072 and an Android front-end.
We’re always looking for unique mechanisms and measurements to dive into here on Hackaday. If you have a favorite in your collection of workbench tricks let us know below and we’ll add it to our list for upcoming articles!


Sweet. This reminds me of the fun part of physics classes. My favorite, though, was wiring our ADC circuits directly into the address bus (through opto-isolators, of course) of a Commodore 64 so that we could get data points every 10 ms when we wrote our apps in assembler. Good times.
Haven’t seen one of those for over forty years.
Had to do this in Microwave Engineering, in college (I’m an RF EE). Hadn’t touched one since. But if I HAD to…
I wonder how easy it would be to use a fluorescent tube and measure of light intensity.
Nice! Another way would have been to use e.g. a three-bit counter IC to divide down the oscillation from ~400 to ~50 MHz, and then observe the result with the oscilloscope.
The one objection is:
Why does this so drastically differ from the values in the datasheet? No offense, but I really trust minicircuits design and spectrum analyzer equipment more than [Steven]’s Lecher line setup. I’d argue that small abbreviations would be totally OK, but for 12 V, he’s off from the datasheet by 20% systematically; now, 20% isn’t that an awesome measurement accuracy, and considering the relatively clean setup, I’d at least have expected *some* kind of explanation of that measurement error.
Because the speed of light in a transmission line is not the same as in vacuum.
Given that the wires are surrounded by air, and that the relative permittivity of air is 1.00058986 ± 0.00000050, I think you need to look for another explanation…
There is wooden base under wires. Permittivity of wood is about ε_wood = 2..3. So “overall” propagation velocity will be between c/ε_air and c/ε_wood (it’s possible to get more correct estimation).
Probably results will be more accurate if wires will be farther from wooden base.
There seems to be something to that. I just raised the wires 36cm into the air and am now around 10%.
As done in the post: 8.0V = 352MHz
Raised 36cm in the air: 8.1V = 319MHz
As per Mini-Circuits datasheet: 8.0V = 289.4MHz
Other suggestions welcome.
How about using a metal measuring tape for one of the transmission elements?
You might have to remove paint from part of it (the backside?) to short to it, but then you could read the distance directly.
Using the 8V values as per my previous comment…
300,000,000 m/s / 289,400,000 wavelength/s (Hz) = 1.04 m/wavelength
300,000,000 m/s / 319,000,000 wavelength/s (Hz) = 0.94 m/wavelength
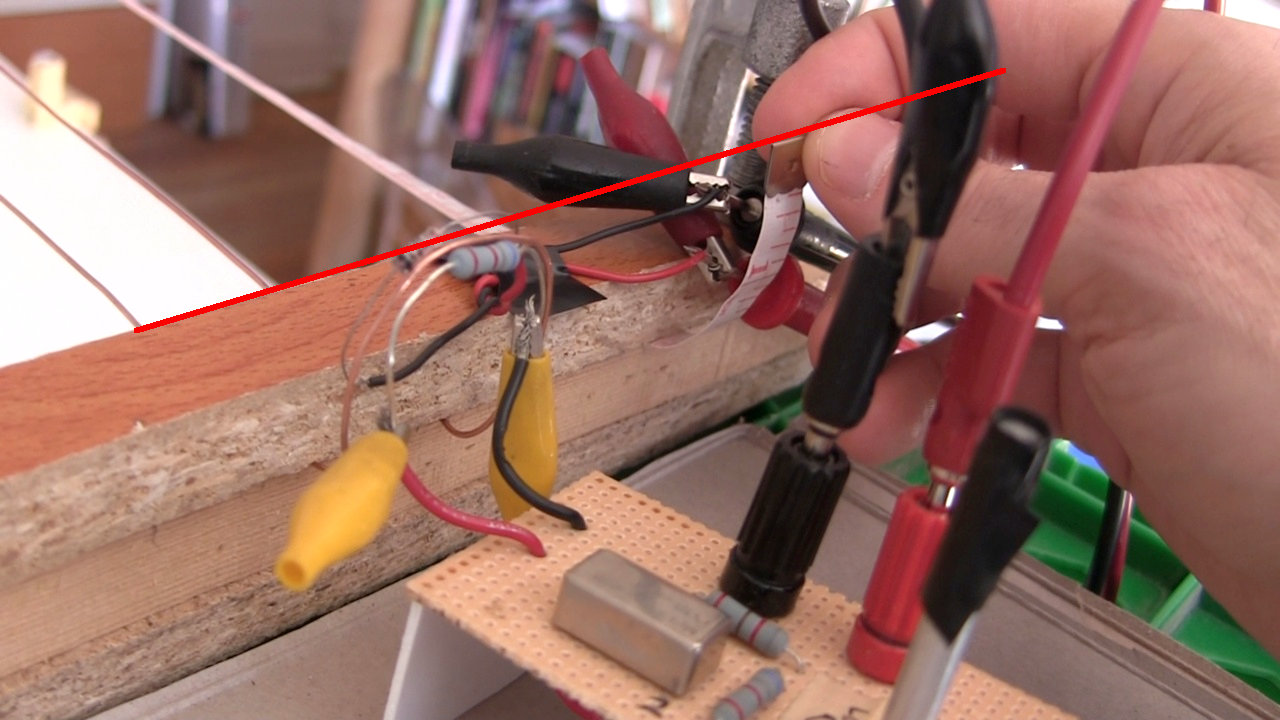
So the distance my screwdriver was off by was 0.1 m or 1 cm (0.39 inches). Wow. I’m glad I just did that math because I didn’t realize it was so close. I graphed it and all my values are consistently off by that much in the same direction so I don’t think increasing the accuracy where I make the measurement using a measuring tape will take care of the 10%. Looking at the chart, the error due to that is much smaller. So it may just come down to what I choose as how I line up the beginning of my measuring tape with the top of the Lecher line’s loop. See the red line in this photo. Does that make sense?
Oh, wait. 0.1m is 10 cm. So I am still off by a lot. Still, switching to a metal measuring tape for one of the lines won’t fix that. The loop is only around 3.5cm tall so starting at the bottom of that won’t help. Something else is still up…
Don’t you have to correct for the difference between the speed of light in a vacuum and your transmission line?
Propagation velocity depends on the dielectric. Air is so close to a vacuum that it’s usually neglected.
Could be wrong, but I believe the wood right next to it will have a significant effect.
No, you don’t _have_ to. You only do that if you want correct results.
Thank you for this. That setup really helps de-mystify its mechanical equivalent at sonic frequencies, the transmission line speaker, and the currently popular mathematical model for it as described by Martin J. King.
Really cool. I wonder if this same effect would work even if the two Lecher wires were not connected at all- I think it might because presumably inductance is conveyed by light particles.
actually I see that the diode is needed to measure an electric potential so the two Lecher wires need to be connected at that end. It would be interesting to hear more explanation of how light is emitted at say 300MHz frequency, absorbed by the two Lecher wires, and the screwdriver completes the circuit at various lengths, and when at 1/2 or full interval length, a large electric potential is created between the two lines at the diode, while not at one of those nodes only a small potential exists. The wikipedia article has a good description of this phenomenon. Apparently the screwdriver causes a reflection creating a standing wave of voltage and current on the line. It would be great to see a visual explanation showing using a light particle model- showing how the light particles are absorbed and create the electric potential between both sides of the diode when the screwdriver is at a node.
Very cool stuff! Thanks for sharing!
I agree with Ralph that the speed of light through your medium needs to be taken into account, it can be quite a bit slower (60-70%) and that might explain the error that Marcus pointed out. See Velocity factor.
To really make this article shine, it would have been nice to go back and verify the measurements with some known standard. I realize you did this because you don’t have a spectrum analyzer handy, but most VHF/UHF radios (listen for quieting in FM that indicates that the radio has found a signal, or better yet, listen for the tone in Single Side Band mode, but most radios don’t have that), or even an RTL-SDR could be used to double check (or maybe remove the need for) your measurements.
I’ve never done what you did here (I’m lucky to have some fairly fancy tools) but I have done the reverse: measured the reflection characteristics of a line, located the frequency of the nodes, and used that to calculate the wavelength of a transmission line, and then used physical measurements of the line to calculate the velocity factor.
You guys should do a retrotachular on ECGs. Detecting really tiny current with a long filament, huge magnets, and some optics.
I’m happily married but the lecher line sounds a fun project.
Check this out (it probably has a few other neat methods in it too):
Radar circuit analysis
by United States. Dept. of the Air Force
Published 1959
https://archive.org/stream/radarcircuitanal00unit#page/n335/mode/2up/search/Lecher+line
The POS-400+ is kind of an interesting and rare chip. it has very few vendors selling it. How does it work – does anybody know? How does it differ from the POS-400?
The +Suffix identifies RoHS Compliance.
The MiniCircuits VCO used here is a black box, but MiniCircuits does make some very nicely engineered, rock solid stuff.
A RF VCO is a common, useful building block in radios, instrumentation and various RF equipment. There are lots of examples of discrete schematics online you might be interested in exploring, especially at modest RF (~100MHz) frequencies where basic construction techniques and transmission lines are not so critical. As a typical example, something like a Colpitts oscillator may be used, tuned with a varicap diode that changes its depletion capacitance strongly as the bias voltage across the diode changes – which is what allows control of the oscillator frequency from an applied bias voltage.
oh ok thanks very cool device
Also available on Arthur H. Compton’s “Chart of Electromagnetic Radiations” (1944):
https://www.flickr.com/photos/llnl/9403051123/sizes/l/
Background: http://physicsbuzz.physicscentral.com/2013/09/making-chart-of-electromagnetic.html
Enhanced version and more background: http://adamjonrichardson.com/2016/04/07/dusted-off-version-of-1944-chart-of-electromagnetic-radiations/
Less than half baked idea, but could a similar setup be used to detect the swinging length of a guitar string?
Could be useful for guitar->MIDI with low latency perhaps…
Just use a TV stick with SDR.
Or if you rather use technology from 2 centuries ago, use that I suppose.
I find that RTL-SDR blog’s rtl based SDR works fantastic for this sporting a nice TCXO and metal case for under $20 and sporting a convenient SMA connector it can measure 2.5 mhz of bandwidth from 25mhz to 1750 mhz with no problem and do it very accurately
The airspy and hackrf are good also if you have a lab reference you want to use!
So that is what a Lecher Line is!
Here I thought it was men in overcoats and galoshes at the ticket counter of an X-rated movie theatre.
Came here for this. Not disappointed.
That doesn’t look anything at all like this.
My Tektronix 100 MHz scope can display waveforms up to about 350 MHz at reduced accuracy but sufficient to see that the oscillator works. More fun discovering Lecher Lines though.
Thanks for suggesting that. I made a loop like the diode loop but without the diode and hooked it up to my Tektronix TDS 220 100 MHz oscilloscope probe and probe ground and tried it. There was a 90 MHz signal of unknown origin that dominated and the induced signal from the oscillator was lower amplitude so it rode on the 90 MHz signal. I had to keep starting and stopping the scope output to try to catch a time when the 90 MHz signal was quiet enough so that I could see a few consecutive peaks of the oscillator’s signal and use the scope’s cursor mode to measure the frequency. I measured the frequency by spanning three of them and then multiplying by three. It was a rough measurement at best and the values don’t form a straight line like the other measurement methods, though they are in the same ballpark. I’m going to be away for a week but I’ve left it all out and will try some more when I return.