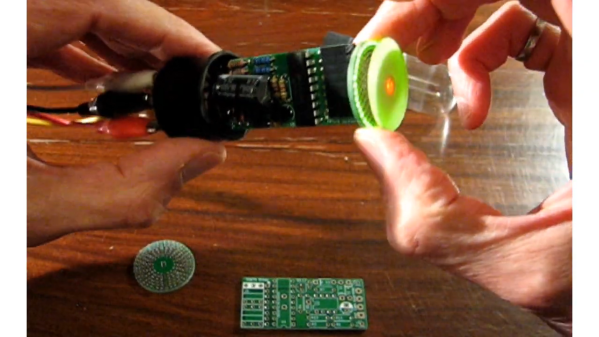
The classic “Magic Eye” tuning indicator was a fantastic piece of vacuum tube technology that graced all kinds of electronic gear for a fair fraction of the 20th century. But despite its prevalence, finding a new-old-stock Magic Eye tube is a tall order these days, especially for the rare versions like the 6T5. No worries, though, since direct plug-in solid-state replacements for the 6T5 are now a thing, thanks to [Gord Rabjohn]. Continue reading “The Eyes Have It With This Solid State Magic Eye”→
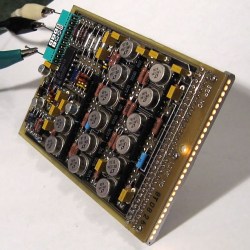
The driver board with display attached; the row of lamps is visible on the right hand side.
LEDs weren’t always an easy solution to displays and indicators. The fine folks at [Industrial Alchemy] shared pictures of a device that shows what kind of effort and cost went into making a high brightness bar graph display in the 70s, back when LEDs were both expensive and not particularly bright. There are no strange materials or methods involved in making the display daylight-readable, but it’s a peek at how solving problems we take for granted today sometimes took a lot of expense and effort.
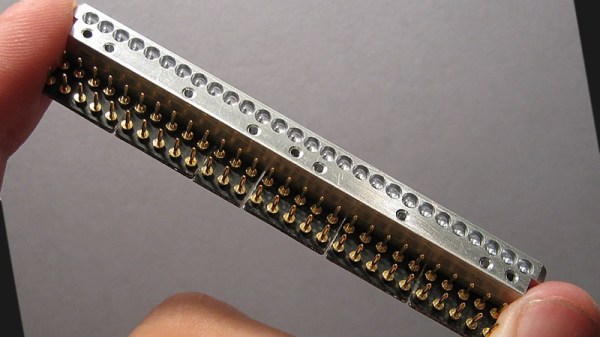
The display is a row of 28 small incandescent bulbs, mounted in a PCB and housed in a machined aluminum frame. Holes through which to view the bulbs are on both the top and front of the metal housing, which allows the unit to be mounted in different orientations. It was made as a swappable module, its 56 machined gold pins mate to sockets on the driver board. The driver board itself consists of 14 LM119 dual comparators, each of which controls two bulbs on the display.
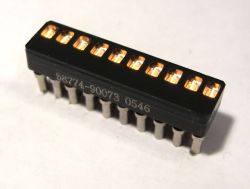
An example of a Wamco minitron bar graph display. Each window contains an incandescent filament. [Source: industrialalchemy.org][Industrial Alchemy] believes that the display unit itself may have been a bit of a hack in its own way. Based on the pin spacing and dimensions of the driver board, they feel that it was probably designed to host a row of modular units known as the Wamco minitron bar graph display. An example is pictured here; they resembled DIP chips and could be stacked side-by-side to make a display of any length. Each window contained an incandescent filament in a reflective well, and each light could be individually controlled.
These minitron bar graph units could only be viewed from the top, and were apparently high in cost and low in availability. Getting around these limitations may have been worth creating this compatible unit despite the work involved.
Display technology has taken many different turns over the years, and you can see examples of many of them in one place in the Circus Clock, which tells the time with a different technology for each digit: a nixie, a numitron, a 7-segment thyratron tube, a VFD, an LED dot display, and a rear projection display.
This VU meter uses Nixie tubes as the display. There are a total of fourteen IN-13 bar graph tubes that map out the audio spectrum. The build uses purely hardware for the display; no microcontroller processing, or dedicated VU-meter chips were used.
Input begins with a dual Op-Amp along with a pair of potentiometers which allow the left and right channels to be balanced. Both channels are then each split into seven signals, which explains the layout of tubes seen above. Each signal is then fed through a voltage divider to envelope the output between 0V and 6V. There is also a low-pass filter to handle sudden volume spikes which don’t work well with the nixies. But as shown in the video after the break, all that work has paid off. Thr clip gives us a look at the green protoboards which host all of this filtering hardware. You’ll want to turn the volume down for the first couple of demonstrations which use a sweep to test the system.
Take a gander at the Giant LED bar graph which [Chunky Hampton] recently completed (from this image we don’t think the nick name suits him). It’s simple both mechanically and electrically, but we love the look and think it would be a nice addition to your home, hackerspace, or as a children’s museum exhibit (we’re looking at you [Mr. Porter]).
The enclosure is a hunk of PVC electrical conduit. It’s got to be one of the largest sizes, but still should be found at most home stores. The base mounts easily and the cover snaps into place. [Chunky] used a hole saw to create the openings for the LED modules. They’re circular boards with multiple single-color LEDs on them. A common power bus feeds the high side of each bit, while a couple of transistor ICs controlled by 595 shift registers address them on the low side. From there just use any controller you wish, but in this case it’s an Arduino.
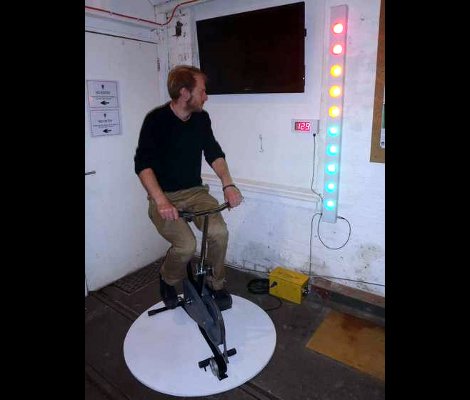
[Chunky] uses the meter to display power output from his stationary bicycle generator. But he also put together a little Larson Scanner demo which you can see after the break.
Ultrasonic rangfinders are a cheap and easy way to gather obstacle avoidance data. When added to a servo motor they form something of a scanning radar for near-proximity objects.
In this implementation, [Rui Cabral] is driving the servo, and collecting data from the sensor using a PIC 18F4520. The servo rotates 180 degreees, taking sensor measurements in increments of nine degrees. If it discovers obstacles, the distance and orientation are recorded. Feedback is displayed on a 20-LED bar graph display which shows a moving LED to track the sensor orientation, with LEDs remaining lit whenever an object is found. Right now the obstacle data is pushed over a serial connection with a PC, but could easily be injected into navigation logic for a robot in order to triangulate a path around the obstruction. You can see [Rui’s] project in action after the break.