Bringing Pro-Level Data Recording To RC Racing

We’re all familiar with the “Black Box” used on commercial aircraft, the flight data recorder which captures the minutia of each and every flight on the off-chance that it’s needed in the event of an accident. But even in less dire circumstances, the complete record of the aircraft’s performance versus what was commanded of it by the pilot can be used to fine tune performance or detect faults before they become serious.

As a data engineer for professional motorsports, [Jussi Luopajärvi] knows similar recorders can be just as useful for vehicles stuck here on terra firma. His entry into the 2019 Hackaday Prize, TestLogger, aims to bring that same kind of technology to the world of RC racing. The gadget allows the driver to easily record a wealth of data about the vehicle during races, giving them valuable insight into the vehicle’s performance.

So what kind of variables are there to record on a 1/8th or 1/12th scale car? Don’t be fooled by their diminutive wheelbases, the modern RC car relies on an impressive amount of technical wizardry that benefits from a close eye.

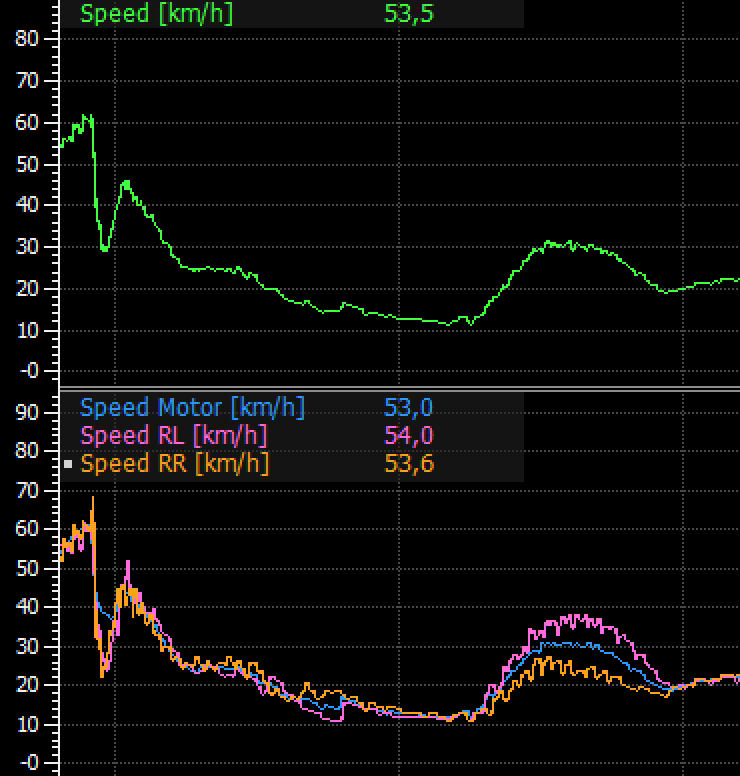
Right now, [Jussi] says TestLogger can record not only obvious elements like battery level and throttle, but also more esoteric variables such as steering input, individual drive wheel speed, angular velocity, and even g-force in three dimensions. There’s also support for a trackside IR beacon that allows TestLogger to record lap times.

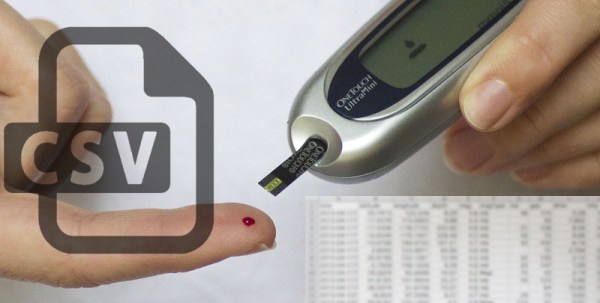
All of the data is stored on TestLogger’s SD card in standard CSV files, which makes it easy for us hacker types to parse and analyze. But for those who are more interested in driving than delimiting, there’s also a very slick website that will let users upload and compare their data. This complete user experience gives TestLogger a very professional feel, and we can’t wait to see where [Jussi] takes it from here.

With powerful microcontrollers available for a song, we expect this kind of detailed data collection is only going to become more common.

Live Apollo 11 Transcript On EInk Display

There are few moments in history that have ever been recorded in more detail or analyzed as thoroughly as the Apollo 11 mission to the Moon. Getting three men to our nearest celestial neighbor and back in one piece took a lot of careful planning, and recording every moment of their journey was critical to making sure things were going smoothly. As we celebrate the 50th anniversary of man’s first steps off our world, these records give us a way to virtually tag along with Armstrong, Aldrin, and Collins.

As part of the 50th anniversary festivities at the Parkes Radio Telescope in Australia, [Andrew] created a badge that would let him wear a little piece of Apollo 11. Using an ESP32 and an eInk screen, it replays the mission transcript between the crew and ground control in real-time. It’s a unique way to experience the mission made possible by that meticulous data collection that’s a hallmark of the National Aeronautics and Space Administration.

[Andrew] was inspired by the “Apollo 11 In Real Time” website, but rather than pulling the content from the Internet, he’s loaded the mission transcripts onto the ESP32’s SPIFFS filesystem as a CSV file. Not that the badge is completely offline, it does need to connect to the Internet (via a hotspot on his phone) so it can keep its internal clock synchronized with NTP. Keeping everything local does reduce power consumption compared to streaming it from the Internet, but he admits that otherwise he didn’t give much thought to energy efficiency and there’s definitely some room for improvement.

The LILYGO TTGO board he’s using combines the ESP32 with a 2.13 inch eInk display, in a formfactor not unlike the Badgy we’ve covered previously. He was able to find a STL for a 3D printed case on Thingiverse which he modified to fit a battery. Unfortunately the original model was released under a license that prevents him from distributing his modified version, but it doesn’t sound too difficult to replicate if you’re interested in building your own running ticker of humanity’s greatest adventure.

Getting Data Off Proprietary Glucometers Gets A Little Easier

Glucometers (which measure glucose levels in blood) are medical devices familiar to diabetics, and notorious for being proprietary. Gentoo Linux developer [Flameeyes] has some good news about his open source tool to read and export data from a growing variety of glucometers. For [Flameeyes], the process started four years ago when he needed to send his glucometer readings to his doctor and ended up writing his own tool. Previously it was for Linux only, but now has Windows support.

Glucometers use a variety of different data interfaces, and even similar glucometers from the same manufacturer can use different protocols. Getting the data is one thing, but more is needed. [Flameeyes] admits that the tool is still crude in many ways, lacking useful features such as HTML output. Visualization and analysis are missing as well. If you’re interested in seeing if you can help, head over to the GitHub repository for glucomerutils. Also needed are details on protocols used by different devices; [Flameeyes] has only been able to reverse-engineer the protocols of meters he owns.

Speaking of glucometers, there is a project for a Universal Glucometer which aims to be able to use test strips from any manufacturer without needing to purchase a different meter.

Thanks for the tip, [Stuart]!

Rigol WFM Viewer Ported For Non-Windows Users

rigol-wfm-parser-for-linux

[Matthias Blaicher] may think this isn’t a big deal when it comes to the amount of work he put into the hack. But for us, anything that extends the functionality of the versatile yet affordable Rigol DS1052E is a win. In this case he’s taken a previous hack and made it work for more people by extending the functionality of the WFM file format viewer.

[Dexter2048] pulled off the original hack which allows this oscilloscope to be used as a spectrum analyzer. [Matthias] didn’t want the tool to be limited to running only on Windows systems so he got to work. This isn’t quite as easy as sounds because the only part of the original code that was released is the parser itself. [Matthias] had to build everything up from that starting point. His software uses standard Python to parse the WFM file and reformat the data. The features included in the current version allow you to export data as a CSV file and even plot the waveform and FFT as seen above.