Remote Water Quality Monitoring

While it can be straightforward to distill water to high purity, this is rarely the best method for producing water for useful purposes. Even drinking water typically needs certain minerals in it, plants may need a certain pH, and wastewater systems have a whole host of other qualities that need to be measured. Measuring water quality is a surprisingly complex endeavor as a result and often involves a wide array of sensors, much like this water quality meter from [RowlesGroupResearch].

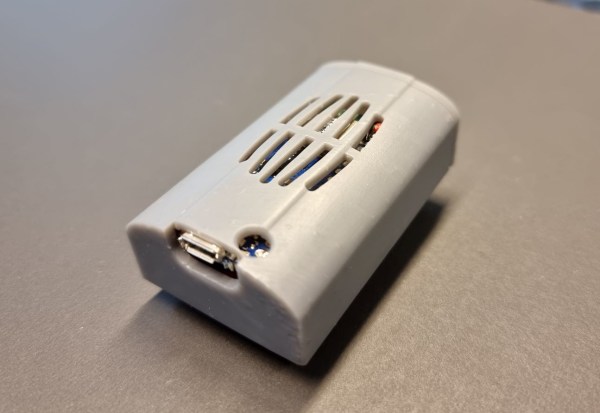
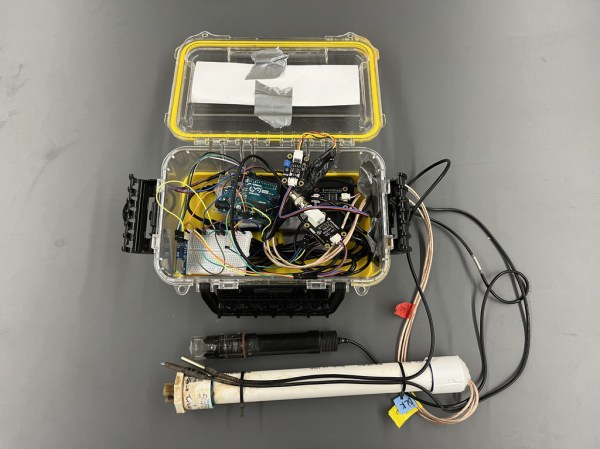
The water quality meters that they are putting to use are typically set up in remote locations, without power, and are targeting natural bodies of water and also wastewater treatment plants. Temperature and pH are simple enough to measure and grasp, but this device also includes sensors for total dissolved solids (TDS) and turbidity which are both methods for measuring various amounts and types of particles suspended in the water. The build is based around an Arduino so that it is easy for others to replicate, and is housed in a waterproof box with a large battery, and includes data logging to an SD card in order to make it easy to deploy in remote, outdoor settings and to gather the data at a later time.

The build log for this device also goes into detail about all of the steps needed to set this up from scratch, as well as a comprehensive bill of materials. This could be useful in plenty of professional settings such as community wastewater treatment facilities but also in situations where it’s believed that industrial activity may be impacting a natural body of water. For a water quality meter more focused on drinking water, though, we’d recommend this build that is trained on its own neural network.

Wearable Sensor Trained To Count Coughs

There are plenty of problems that are easy for humans to solve, but are almost impossibly difficult for computers. Even though it seems that with modern computing power being what it is we should be able to solve a lot of these problems, things like identifying objects in images remains fairly difficult. Similarly, identifying specific sounds within audio samples remains problematic, and as [Eivind] found, is holding up a lot of medical research to boot. To solve one specific problem he created a system for counting coughs of medical patients.

This was built with the idea of helping people with chronic obstructive pulmonary disease (COPD). Most of the existing methods for studying the disease and treating patients with it involves manually counting the number of coughs on an audio recording. While there are some software solutions to this problem to save some time, this device seeks to identify coughs in real time as they happen. It does this by training a model using tinyML to identify coughs and reject cough-like sounds. Everything runs on an Arduino Nano with BLE for communication.

While the only data the model has been trained on are sounds from [Eivind], the existing prototypes do seem to show promise. With more sound data this could be a powerful tool for patients with this disease. And, even though this uses machine learning on a small platform, we have seen before that Arudinos are plenty capable of being effective machine learning solutions with the right tools on board.

GGWave Sings The Songs Of Your Data

We’re suckers for alternative data transmission methods, and [Georgi Gerganov]’s ggwave made us smile. At its core, it’s doing what the phone modems of old used to do – sending data encoded as different audio tones. But GGwave does this with sophistication!

It splits the data into four-bit chunks, and uses 16 different frequency offsets to represent each possible value. But for each chunk, these offsets are added to one of six different base frequencies, which allows the receiving computer to tell which chunk it’s in. It’s like a simple framing concept, and it makes the resulting data sound charmingly like R2-D2. (It also uses begin and end markers to be double-sure of the framing.) The data is also sent with error correction, so small hiccups can get repaired automatically.

What really makes ggwave shine is that it’s ported to every platform you care about: ESP32, Arduino, Linux, Mac, Windows, Android, iOS, and anything that’ll run Python or JavaScript. So it’ll run in a browser. There’s even a GUI for playing around with alternative modulation schemes. Pshwew! This makes it easy for a minimalist microcontroller-based beeper button to control your desktop, or vice-versa. An ESP32 makes for an IoT-style WiFi-to-audio bridge. Write code on your cell phone, and you can broadcast it to any listening microcontroller. Whatever your use case, it’s probably covered.

Now the downside. The data rate is slow, around 64-160 bits per second, and the transmission is necessarily beepy-booopy, unless you pitch it up in to the ultrasound or use the radio-frequency HackRF demo. But maybe you want to hear when your devices are talking to each other? Or maybe you just think it’s cute? We do, but we wouldn’t want to have to transmit megabytes this way. But for a simple notification, a few bytes of data, a URL, or some configuration parameters, we can see this being a great software addition to any device that has a speaker and/or microphone.

Oh my god, check out this link from pre-history: a bootloader for the Arduino that runs on the line-in.

Continue reading “GGWave Sings The Songs Of Your Data”

Teensy Spectrum Analyzer Has 170 Channels

While high-fidelity audio has come a long way in the past several decades, a lot of modern stereo equipment is still missing out on some of the old analog meters that were common on amplifiers and receivers of the 60s through the 80s. Things like VU meters don’t tend to be common anymore, but it is possible to build them back in to your sound system with the help of some microcontrollers. [Mark] shows us exactly how to reclaim some of the old-school functionality with this twin audio visualizer display.

Not only does this build include two displays, but the microcontroller is keeping up with 170 channels in real-time in order to drive the display. What’s more impressive is that it’s being done all on a Teensy 4.1. To help manage all of the data and keep the speed as fast as possible it uses external RAM soldered to the board, and a second Teensy audio board is used to do the real time FFT analysis. Most of the channels are sent to the display hosting the spectrum analyzer but two are reserved for left and right stereo VU meters on the second display.

The project from [Mark] is originally based on this software from [DIYLAB] so everything is open-source. While it was originally built for a specific piece of hardware, [Mark] has it set up with a line in and line out plus a microphone input so it can be used for virtually any audio hardware now. For another take on the classic VU meter, take a look at this design based on an Arudino instead.

Continue reading “Teensy Spectrum Analyzer Has 170 Channels”

Supersized Weather Station Uses Antique Analog Meters

For most of us, getting weather information is as trivial as unlocking a smartphone or turning on a computer and pointing an app or browser at one’s weather site of choice. This is all well and good, but it lacks a certain panache that old weather stations had with their analog dials and stained wood cases. The weather station that [BuildComics] created marries both this antique aesthetic with modern weather data availability, and then dials it up a notch for this enormous analog weather station build.

The weather station uses 16 discrete dials, each modified with a different label for the specific type of data displayed. Some of them needed new glass, and others also needed coils to be modified to be driven with a lower current than they were designed as well, since each would be driven by one of two Arduinos in this project. Each are tied to a microcontroller output via a potentiometer which controls the needle’s position for the wildly different designs of meter. The microcontrollers themselves get weather information from a combination of real-world sensors outside the home of [BuildComics] and from the internet, which allows for about as up-to-date information about the weather as one could gather first-hand.

The amount of customization of these old meters is impressive, and what’s even more impressive is the project’s final weight. [BuildComics] reports that it took two people just to lift it onto the wall mount, which is not surprising given the amount of iron in some of these old analog meters. And, although not as common in the real world anymore, these old antique meters have plenty of repurposed uses beyond weather stations as well.

Continue reading “Supersized Weather Station Uses Antique Analog Meters”

Dynamic Map Of Italy On A PCB

While most PCBs stick to tried-and-true methods of passing electrons through their layers of carefully-etched copper, modern construction methods allow for a large degree of customization of most aspects of these boards. From solder mask to number of layers, and even the shape of the board itself, everything is open for artistic license and experimentation now. [Luca] shows off some of these features with his PCB which acts as a live map of Italy.

The PCB is cut out in the shape of the famous boot, with an LED strategically placed in each of 20 regions in the country. This turns the PCB into a map with the RGB LEDs having the ability to be programmed to show any data that one might want. It’s powered by a Wemos D1 Mini (based on an ESP8266) which makes programming it straightforward. [Luca] has some sample programs which fetch live data from various sources, with it currently gathering daily COVID infection rates reported for each of the 20 regions.

The ability to turn a seemingly boring way to easily attach electronic parts together into a work of art without needing too much specialized equipment is a fantastic development in PCBs. We’ve seen them turned into full-color art installations with all the mask colors available, too, so the possibilities for interesting-looking (as well as interesting-behaving) circuits are really opening up.

Continue reading “Dynamic Map Of Italy On A PCB”

Adding Space Music To The Astronomy Toolbox

Astronomy fans were recently treated to the Great Conjunction, where Jupiter and Saturn appear close together from the perspective of our planet Earth. Astronomy has given us this and many other magnificent sights, but we can get other senses involved. Science News tells of explorations into adapting our sense of hearing into tools of astronomical data analysis.

Data visualization has long been a part of astronomy, but they’re not restricted to charts and graphs that require a trained background to interpret. Every “image” generated using data from radio telescopes (like the recently-lost Arecibo facility) are a visualization of data from outside the visible spectrum. Visualizations also include crowd pleasing false-color images such as The Pillars of Creation published by NASA where interstellar emissions captured by science instruments are remapped to colors in the visible spectrum. The results are equal parts art and science, and can be appreciated from either perspective.

Data sonification is a whole other toolset with different strengths. Our visual system evolved ability to pick out edges and patterns in spatial plots, which we exploit for data visualization. In contrast our aural system evolved ability to process data in the frequency domain, and the challenge is to figure out how to use those abilities to gain scientifically relevant data insight. For now this field of work is more art than science, but it does open another venue for the visually impaired. Some of whom are already active contributors in astronomy and interested in applying their well-developed sense of hearing to their work.

Of course there’s no reason this has to be restricted to astronomy. A few months ago we covered a project for sonification of DNA data. It doesn’t take much to get started, as shown in this student sonification project. We certainly have no shortage of projects that make interesting sounds on this site, perhaps one of them will be the key.