A Look Behind The “Big Boards” At Mission Control In The Golden Age Of NASA

Certified space-nerd and all-around retro-tech guru [Fran Blanche] has just outdone herself with a comprehensive look at how NASA ran the Mission Control “Big Boards” that provided flight data for controllers for Apollo and for the next 20 years of manned spaceflight.

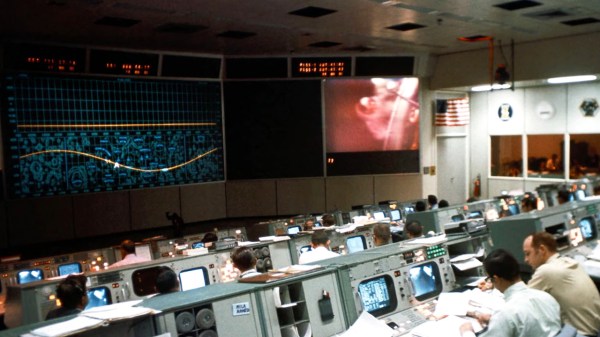
We’ve got to admit, [Fran] surprised us with this one. We had always assumed that the graphs and plots displayed in front of the rows of mint-green consoles and their skinny-tie wearing engineers were video projections using eidophor projectors. And to be sure, an eidophor, the tech of which [Jenny] profiled a while back, was used on one of the screens to feed video into Mission Control, either live from the Moon or from coverage of the launch and recovery operations. But even a cursory glance at the other screens in front of “The Pit” shows projections of a crispness and clarity that was far beyond what 1960s video could achieve.

Instead, plots and diagrams were projected into the rear of the massive screens using a completely electromechanical system. Glass and metal stencils were used to project the icons, maps, and grids, building up images layer by layer. Colors for each layer were obtained by the use of dichroic filters, and icons were physically moved to achieve animations. Graphs and plots were created Etch-a-Sketch style, with a servo-controlled stylus cutting through slides made opaque with a thin layer of metal. The whole thing is wonderfully complex, completely hacky, and a great example of engineering around the limits of technology.

Hats off to [Fran] for digging into this forgotten bit of Space Race tech. Seeing something like this makes the Mission Control centers of today look downright boring by comparison.

Continue reading “A Look Behind The “Big Boards” At Mission Control In The Golden Age Of NASA”

Stay Informed: How To Pull Your Own COVID-19 Data

For all the technology we have, it can still be frustratingly difficult to get any concrete information from the media. Sometimes all you want to do is to cut through the noise and see some real numbers. Watching talking heads argue for a half hour probably isn’t going to tell you much about how the COVID-19 virus is spreading through your local community, but seeing real-time data pulled from multiple vetted sources might.

Having access to the raw data about COVID-19 cases, fatalities, and recoveries is, to put it mildly, eye-opening. Even if day to day life seems pretty much unchanged in your corner of the world, seeing the rate at which these numbers are climbing really puts the fight into perspective. You might be less inclined to go out for a leisurely stroll if you knew how many new cases had popped up in your neck of the woods during the last 24 hours.

But this article isn’t about telling you how to feel about the data, it’s about how you can get your hands on it. What you do with it after that is entirely up to you. Depending on where you live, the numbers you see might even make you feel a bit better. It’s information on your own terms, and in these uncertain times, that might be the best we can hope for.

Continue reading “Stay Informed: How To Pull Your Own COVID-19 Data”

A Super-Brain For An E-bike

There’s no better way of improving a project than logging data to make informed decisions on future improvements. When it came to [Brian]’s latest project, an electric bike, he wanted to get as much data as he could from the time he turned it on until the time he was finished riding. He turned to a custom pyBoard-based device (and wrote it up on Hackaday.io), but made it stackable in order to get as much information from his bike as possible.

This isn’t so much an ebike project as it is about a microcontroller platform that can be used as a general purpose device. All of the bike’s controls flow through this device as a logic layer, so everything that can possibly be logged is logged, including the status of the motor and battery at any given moment. This could be used for virtually any project, and the modular nature means that you could scale it up or down based on your specific needs. The device is based on an ARM microcontroller so it has plenty of power, too.

While the microcontroller part is exceptionally useful ([Brian] talks about some of its other uses here and gives us even more data on his personal webpage), we shouldn’t miss the incredible bike that [Brian] built either. It has a 3 kW rear hub motor and can reach speeds of around 60 mph. While we let the commenters below hash out the classic argument of “bicycle vs. motorcyle” we’ll be checking out some electric vehicles that are neither.

A Tamagotchi For WiFi Cracking

OK, let’s start this one by saying that it’s useful to know how to break security measures in order to understand how to better defend yourself, and that you shouldn’t break into any network you don’t have access to. That being said, if you want to learn about security and the weaknesses within the WPA standard, there’s no better way to do it than with a tool that mimics the behavior of a Tamagotchi.

Called the pwnagotchi, this package of artificial intelligence looks for information in local WiFi packets that can be used to crack WPA encryption. It’s able to modify itself in order to maximize the amount of useful information it’s able to obtain from whatever environment you happen to place it in. As an interesting design choice, the pwnagotchi behaves like an old Tamagotchi pet would, acting happy when it gets the inputs it needs.

This project is beyond a novelty though and goes deep in the weeds of network security. If you’re at all interested in the ways in which your own networks might be at risk, this might be a tool you can use to learn a little more about the ways of encryption, general security, and AI to boot. Of course, if you’re new to the network security world, make sure the networks you’re using are secured at least a little bit first.

Thanks to [Itay] for the tip!

Maps To SMS, When You’re Really Far Away

GPS is available on most smart phones, which is all well and good unless you drive out into a place with weak service. Unless you want to go into the before-time and buy a standalone GPS (and try to update the maps every so often) or go even further back and print out MapQuest directions, you’ll need another solution to get directions. Something like this project which sends Google Maps directions over SMS.

The project is called RouteMe by [AhadCove]. It runs on a Raspberry Pi at his home which is constantly monitoring an email inbox. Using Google Voice to forward incoming text messages as emails to the Pi, the system works when your phone has a cell signal but no data connection. The Pi listens for specific commands in that SMS-to-Email connection and is able to send directions back to the phone via text message. That’s actually a neat hack you may remember from the olden days where you can send email as SMS using the phone number as the address.

If you find yourself lost in the woods with just your phone often enough, [AhadCove] has all of the code and detailed directions on how to set this up on his GitHub site. But don’t discount this particular task, anything you can script on the Pi can now be controlled via SMS without relying on a service like Twilio.

This maps hack is a pretty ingenious solution to a problem that more than a few of us have had, and it uses a lot of currently-available infrastructure to run as well. If you want another way of navigating without modern tech, have a go at dead reckoning in a car.

Is Solar Right For You? Find Out!

Solar panels are revolutionizing the electric power industry, but not everyone is a good candidate for rooftop solar. Obviously people in extreme northern or sothern latitudes aren’t going to be making a ton of energy during the winter compared to people living closer to the equator, for example, but there are other factors at play that are more specific to each individual house. To find out if any one in particular will benefit from solar panels, [Jake] and [Ryan]’s solar intensity sensor will help you find out.

The long-term intensity tracker is equipped with a small solar panel and a data recording device, properly contained in a waterproof enclosure, and is intended to be placed in the exact location that a potential solar installation will be. Once it has finished gathering data, it will help determine if it makes economical sense to install panels given that the roof slope might not be ideal, landscaping may be in the way, or you live in a climate where it rains a lot in the summer during peak production times.

As we move into the future of cheap, reliable solar panels, projects like this will become more and more valuable. If you’re not convinced yet that photovoltaics are the way of the future, though, there are other ways of harnessing that free solar power.

A Baby’s First Year In Data, As A Blanket

New parents will tell you that a baby takes a few months to acquire something close to a day/night sleep pattern, and during that time Mom and Dad also find their sleep becomes a a rarely-snatched luxury. [Seung Lee] has turned this experience into a unique data visualisation, by taking the sleep pattern data of his son’s first year of life and knitting it into a blanket.

The data was recorded using the Baby Connect app, from which it was exported and converted to JSON. This was in turn fed to some HTML/Javascript which generated a knitting pattern in a handy format that could be displayed on any mobile or portable device for knitting on the go. The blanket was then knitted by hand as a series of panels that were later joined into one, providing relief as the rows lined up.

The finished product shows very well the progression as the youngster adapts to a regular sleep pattern, and even shows a shift to the right at the very bottom as a result of a trip across time zones to see relatives. It’s both a good visualisation and a unique keepsake that the baby will treasure one day as an adult. (Snarky Ed Note: Or bring along to the therapist as evidence.)

This blanket was hand-knitted, but it’s not the first knitted project we’ve seen. How about a map of the Universe created on a hacked knitting machine?