A Tshwatch on a table

TshWatch Helps You Learn More About Yourself

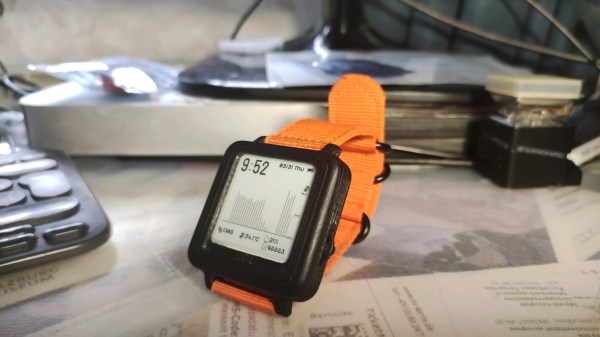
TshWatch is a project by [Ivan / @pikot] that he’s been working on for the past two years. [Ivan] explains that he aims to create a tool meant to help you understand your body’s state. Noticing when you’re stressed, when you haven’t moved for too long, when your body’s temperature is elevated compared to average values – and later, processing patterns in yourself that you might not be consciously aware of. These are far-reaching goals that commercial products only strive towards.

At a glance it might look like a fitness tracker-like watch, but it’s a sensor-packed logging and measurement wearable – with a beautiful E-Ink screen and a nice orange wristband, equipped with the specific features he needs, capturing the data he’d like to have captured and sending it to a server he owns, and teaching him a whole new world of hardware – the lessons that he shares with us. He takes us through the design process over these two years – now on the fifth revision, with first three revisions breadboarded, the fourth getting its own PCBs and E-Ink along with a, and the fifth now in the works, having received some CAD assistance for battery placement planning. At our request, he has shared some pictures of the recent PCBs, too!

Continue reading “TshWatch Helps You Learn More About Yourself”

Easy IoT Logging Options For The Beginner

If a temperature sensor takes a measurement in the woods but there’s nobody around to read it, is it hot out? 

If you’ve got a project that’s collecting data, you might have reasons to put it online. Being able to read your data from anywhere has its perks, after all, and it’s key to building smarter interconnected systems, too. Plus, you can tell strangers the humidity in your living room while you’re out at the pub, and they’ll be really impressed.

Taking the leap into the Internet of Things can be daunting however, with plenty of competing services and options from the basic to the industrial-strength available. Today, we’re taking a look at two options for logging data online that are accessible to the beginner. Continue reading “Easy IoT Logging Options For The Beginner”

Data Logging Like It’s 1982

If you want to log voltages or resistance these days, no problem. You can buy a multimeter with Bluetooth for a hundred bucks, and if you’re really fancy you can spring for the Fluke with a graphical display that will log values automatically. Things weren’t always this cheap and easy, but there was always a way to do it.

Back in the 80s, HP had GPIB, or HP-IB, or IEEE-488 connectors on the back of their benchtop equipment. This was an 8-bit interface not unlike a parallel port that allowed for remote control of test equipment. In a great demonstration of what this was actually like, [AkBKukU] posted a video of connecting an old benchtop multimeter to a vintage computer over GPIB.

The computer used for this feat of retrotechtacularness is an HP Series 80, a footnote in the history of desktop computers, but it does have a custom CPU and BASIC in ROM. As you would expect from vintage HP gear, there are a few slots on the back of the computer for connecting interface boxes, including a modem, a speech synthesizer, and of course, an HP-IB interface that can speak IEEE-488.

With the multimeter connected to the computer over the daisy-chainable parallel interface, it was a simple matter of writing a little bit of BASIC to read a potentiometer and a thermistor. With a little bit more code, this computer can even produce a graph of the resistance over time. This is data logging like it’s 1982, and it’s a fantastic example of exactly how far we’ve come.

Continue reading “Data Logging Like It’s 1982”

Review: IoT Data Logging Services With MQTT

For the last few months, I had been using Sparkfun’s Phant server as a data logger for a small science project. Unfortunately, they’ve had some serious technical issues and have discontinued the service. Phant was good while it lasted: it was easy to use, free, and allowed me to download the data in a CSV format. It shared data with analog.io, which at the time was a good solution for data visualization.

While I could continue using Phant since it is an open-source project and Sparkfun kindly releases the source code for the server on Github, I thought it might be better to do some research, see what’s out there. I decided to write a minimal implementation for each platform as an interesting way to get a feel for each. To that end, I connected a DHT11 temperature/humidity sensor to a NodeMCU board to act as a simple data source.

Continue reading “Review: IoT Data Logging Services With MQTT”

ESP32 Hamster Wheel Tracker Tweets Workout Stats

Even with all the hamster wheel trackers out there (and on this site) there’s room for improvement. [Bogdan] upgraded his hamster wheel from an Arduino and datalogging shield to an ESP32, and unleashed some new capabilities one does not ordinarily associate with hamster wheels.

[Bogdan]’s project logs distance in feet, duration of current session in time, RPM, overall revolutions, speed in MPH, and overall number of sessions, as well as a couple of system monitoring stats. It also tracks multiple wheels, as [Piontek] (the hamster) has two. However, thanks to the ESP32, [Bogdan]’s wheel tracker tweets its stats and updates a ThingSpeak dashboard with [Piontek]’s workouts.

In addition to its functionality, [Bogdan] made a point to make the project look and feel FINISHED. He designed custom 3D parts including a front plate, hooks for attaching the control box to the cage, and mounts for attaching the sensor to the wheel.

Continue reading “ESP32 Hamster Wheel Tracker Tweets Workout Stats”

Hackaday Prize Entry: DIY Foot Orthotics

What does your gait look like to your foot? During which part of your gait is the ball of your feet experiencing the most pressure? Is there something wrong with it? Can you fix it by adding or removing material from a custom insole? All these answers can be had with an expensive system and a visit to a podiatrist, but if [Charles Fried] succeeds you can build a similar system at home. 

The device works by having an array of pressure sensors on a flat insole inside of a shoe. When the patient walks, the device streams the data to a computer which logs it. The computer then produces a heat map of the person’s step. The computer also produces a very useful visualization called a gait line. This enables the orthotist to specify or make the correct orthotic.

[Charles]’s version of this has another advantage over the professional versions. His will be able to stream wirelessly to a data logger. This means you can wear the sensor around for a while and get a much more realistic picture of your gait. Like flossing right before the dentist, many people consciously think about their gait while at the foot doctor; this affects the result.

He currently has a prototype working. He’s not sure how long his pressure sensors will last in the current construction, and he’s put wireless logging on hold for now. However, the project is interesting and we can’t wait to see if [Charles] can meet all his design goals.

The HackadayPrize2016 is Sponsored by:

USB Datalogging With Arduino Using V-USB

Adding USB functionality to your Arduino projects used to be a pain, but thankfully, the V-USB project came along and gave your ATMEGA328 the ability to control the USB lines directly and mimic simple (low-speed) USB peripherals. [Ray] shows an implementation of the V-USB project by logging the status of the Arduino’s I/O pins to an open Excel spreadsheet

V-USB (Virtual USB) is especially useful for those of us who build standalone Arduino projects with the ATMEGA328. Unlike the Arduino Leonardo and its ATMEGA32U4, the ATMEGA328 does not have a built-in USB controller. The circuit required to tie into the USB lines is made up of just a few basic components, and [Ray] provides a reference schematic and BOM to get you started. The Arduino is programmed to mimic a keyboard, so the datalogging is achieved by allowing the Arduino to ‘type’ the data into an open Excel spreadsheet. In this example, the status of 8 digital pins and all 6 Analog Input pins are logged.

For those of you who prefer the PIC microcontroller and are in a similar position of not having a built-in USB controller, there is the 16FUSB project to help you out.