Remoticon Video: Basics Of RF Emissions Debugging Workshop

These days we’re surrounded by high-speed electronics and it’s no small feat that they can all play nicely in near proximity to each other. We have RF emissions standards to thank, which ensure new products don’t spew forth errant signals that would interfere with the data signals traveling through the ether. It’s long been the stuff of uber-expensive emissions testing labs, and failure to pass can leave you scratching your head. But as Alex Whittimore shows in this workshop from the 2020 Hackaday Remoticon, you can do a lot of RF emissions debugging with simple and inexpensive tools.

Professionally-made probes in several sizes
Build your own probes from magnet wire

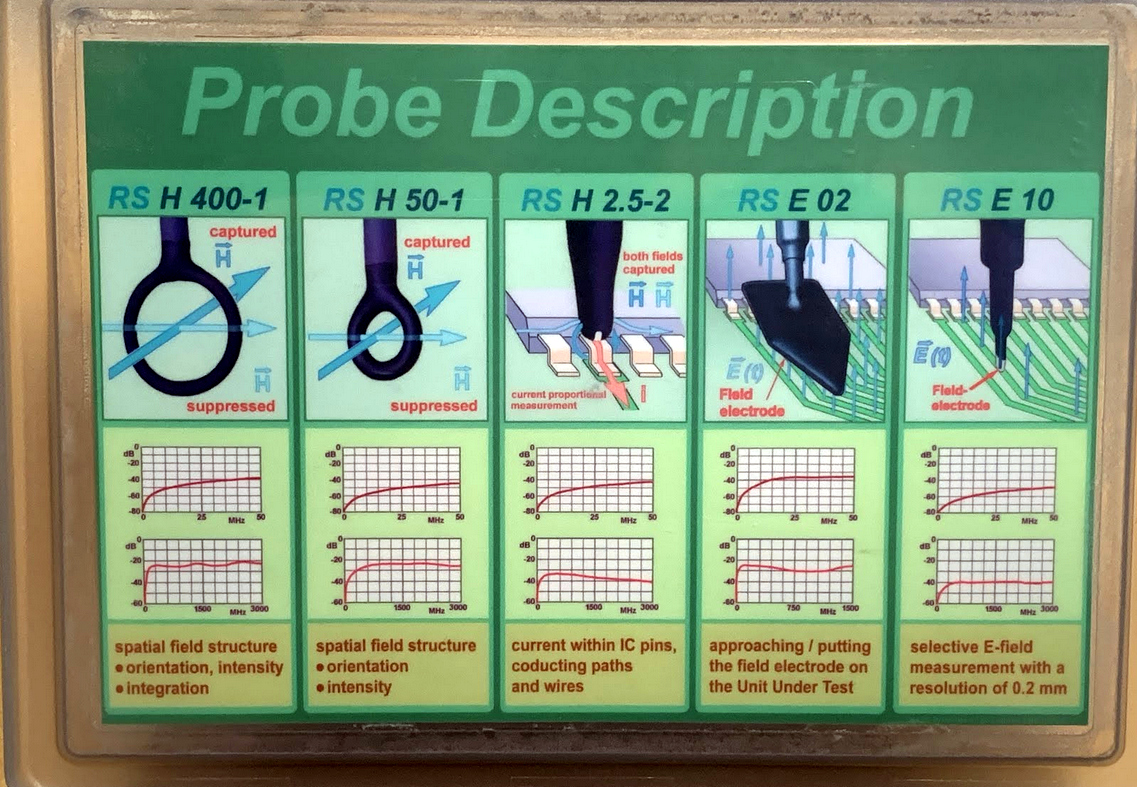
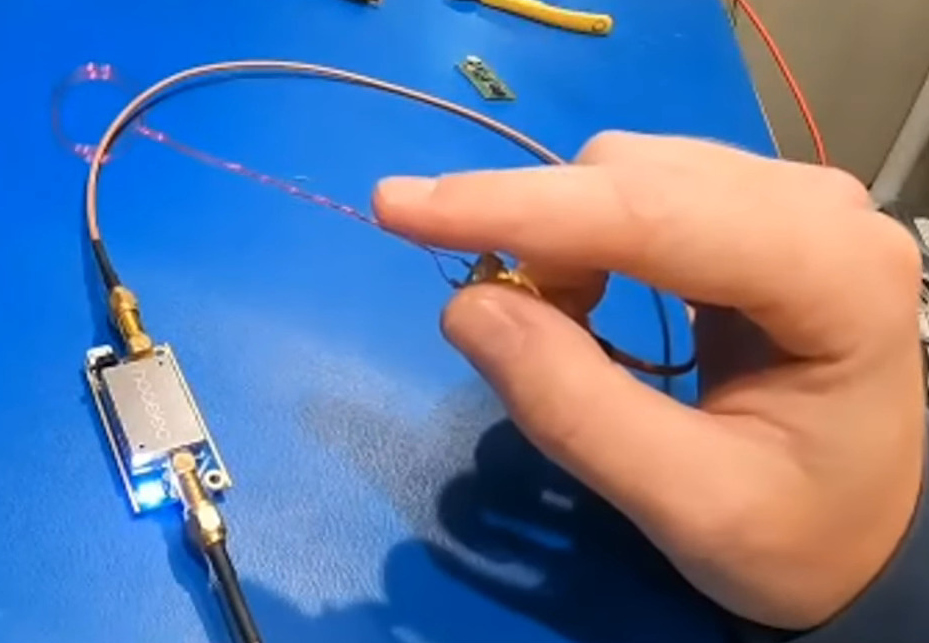
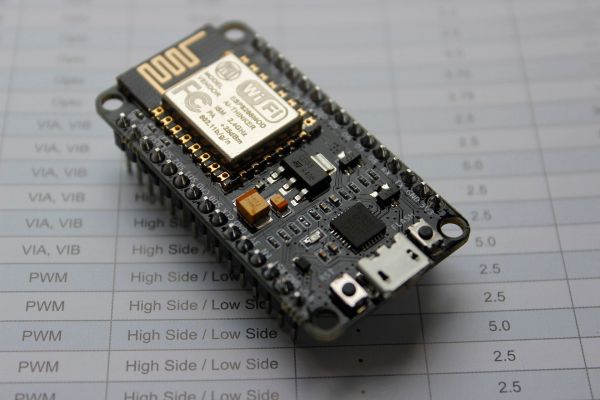
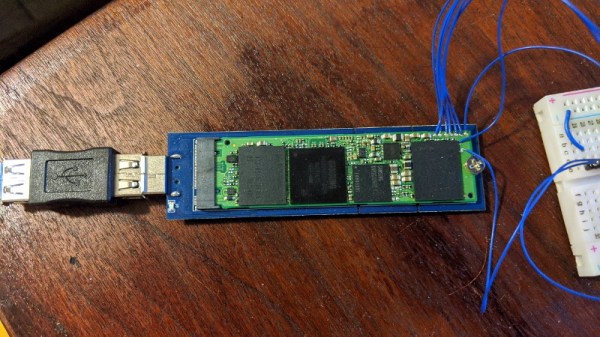
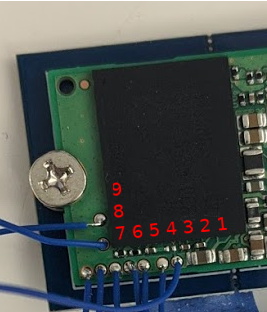
You can get a surprisingly clear picture of what kind of RF might be coming off of a product by probing it on your own workbench. Considering the cost of the labs performing FCC and other certifications, this is a necessary skill for anyone who is designing a product headed to market — and still damn interesting for everyone else. Here you can see two examples of the probes used in the process. Although one is a pack of professional tools and other is a bit of enameled wire (magnet wire), both are essentially the same: a loop of wire on which a magnetic field will induce a very small current. Add a Low-Noise Amplifier (LNA) and you’ll be up and measuring in no-time.

I really enjoyed how Alex started his demo with “The Right WayTM” of doing things — using a proper spectrum analyzer to visualize data from the probes. But the real interesting part is “The Hacker WayTM” which leverages an RTL-SDR dongle and some open-source software to get the same job done. Primarily that means using SDRAngel and QSpectrumAnalyzer which are both included in the DragonOS_LTS which can be run inside of a virtual machine.
Continue reading “Remoticon Video: Basics Of RF Emissions Debugging Workshop”

Beyond Printf(): Better Logging Practices For Faster Debugging

All of us who do some programming know that logging is a time-tested way to output messages about the internal state of our code. With varying degrees of adjustable granularity, these messages allow us to keep track of not only the state of the application, but also its overall health. When things do end up going FUBAR, these log messages are usually the first thing we look at as a software equivalent of a Flight Data Recorder in an airplane.

Spending some time and care in not only designing the logging system, but also in deciding what should be logged and at what level, can make our future self appreciate life a lot more. We’re all familiar with the practice of ‘printf-debugging’, where logging is added as part of the usual post-crash autopsy as one tries to figure out what exactly went wrong. It’s one way of doing it, and eventually it works, but we can do much better.

People are lazy, and you’re only going to stick to good logging practices if they are at least as easy if not easier than sprinkling printf() statement throughout the code. Yet at the same time we want to be able to handle things like log levels and newlines without too much extra typing. The most successful logging libraries are built with this

Continue reading “Beyond Printf(): Better Logging Practices For Faster Debugging”

Adding WiFi To Black Magic For Wireless GDB Action

[Thoquz] wrote to us about an interesting GitHub project by [Valmantas Palikša] involving the porting of the Black Magic firmware to ESP8266. For those who are unaware, Black Magic Probe is firmware along with a range of official and third-party boards that targets the debugging of Cortex-M and Cortex-A MCUs and SoCs.

With this blackmagic-espidf project, one can use any ESP8266 board that has at least 2 MB of Flash program storage, though 1 MB should be possible if OTA updated are disabled. After flashing the firmware to the ESP8266 board, the GDB server can be reached on TCP port 2022 and UDP 2023, with a serial port available via TCP/23, UDP2323, or via the physical TX0/RX0 pins on the ESP8266.

The target board to be debugged  is hooked up by default to GPIO0 (SWDIO) and GPIO2 (SWCLK) for Serial Wire Debugging, though JTAG is also said to be supported. If set up properly, next one should be able to pop into a fresh remote GDB session:

gdb connection

If you don’t want the WiFi, you can buy a wired one, or just roll your own from any STM32 board that you’ve got kicking around.

Using Valgrind To Track Down Known And Unknown Bugs In Your Code

We all know what bugs in code are. We don’t like them when they are in programs we use, and they’re even worse when they are in code which we have written. Clearly, the best code is bug-free, but how do we get there?

This isn’t a new question, of course, just one that has become ever more important as the total number of lines of code (LoC) that run modern day society keeps increasing and which is affecting even hobbyists more and more often now that everything has a microcontroller inside.

Although many of us know the smug satisfaction of watching a full row of green result markers light up across the board after running the unit tests for a project, the painful reality is that you don’t know whether the code really is functionally correct until it runs in an environment that is akin to the production environment.  Yet how can one test an application in this situation?

This is where tools like those contained in the Valgrind suite come into play, allowing us to profile, analyze and otherwise nitpick every single opcode and memory read or write. Let’s take a look, shall we?

Continue reading “Using Valgrind To Track Down Known And Unknown Bugs In Your Code”

Debugging For Sed — No Kidding

If you do much Linux shell scripting, you’ve probably encountered sed — the stream editor — in an example. Maybe you’ve even used it yourself. If all you want to do is substitute text, it is easy and efficient. But if you try to do really elaborate editing, it is often difficult to get things right. The syntax is cryptic and the documentation is lacking. But thanks to [SoptikHa2] you can now debug sed scripts with a text-based GUI debugger. Seriously.

According to the author, the program has several notable features:

  • Preview variable values, both of them!
  • See how will a substitute command affect pattern space before it runs
  • Step through sed script – both forward and backward!
  • Place breakpoints and examine program state
  • Hot reload and see what changes as you edit source code
  • Its name is a palindrome

There’s only one word for that last feature: wow.

Continue reading “Debugging For Sed — No Kidding”

A Hacker’s Guide To JTAG

If you’re reading Hackaday, you’ve almost certainly heard of JTAG. There’s an excellent chance you’ve even used it once or twice to reflash an unruly piece of hardware. But how well do you actually know JTAG? More specifically, do you know how useful it can be when reverse engineering hardware?

Whether you’re a JTAG veteran or a novice, this phenomenal guide written by [wrongbaud] is sure to teach you a thing or two. Starting with a low-level explanation of how the interface actually works, the guide takes you though discovering JTAG ports on unknown targets, the current state-of-the-art in open source tools to interact with the device, and finally shows a real-world example of pulling and analyzing a gadget’s firmware.

There’s no way to do his write-up justice with a breakdown or a summary, so we won’t even try. Just get comfortable, maybe grab a drink, and dive in. It’s certainly not a short read, but there isn’t a wasted word on the page. Every piece of the puzzle, from how to figure out an unlabeled pinout to determining the instruction length, is explained in exactly the amount of detail you’re looking for. This is a guide for hackers written by a hacker, and it shows.

It will probably come as no surprise to find this isn’t the first time [wrongbaud] has done a deep dive like this. Over the last few months we’ve been covering his series of practical reverse engineering guides, and each one has been an invaluable resource. Perfect study guides for when a global pandemic has you stuck in the house.

Linux Fu: Tracing System Calls

One of the nice things about Linux and similar operating systems is that you can investigate something to any level you wish. If a program has a problem you can decompile it, debug it, trace it, and — if necessary — even dig into the source code for the kernel and most of the libraries the program is probably using. However, the tools to do this aren’t ones you use every day. One very interesting tool is strace. Using it you can see what system calls any program makes and that can sometimes give you important clues about how the program works or, probably more often, why it doesn’t work.

Let’s consider the least complex use of the command. Suppose you want to make symlink from testxmit.grc to the /tmp directory. That command is simple:

ln -sf testxmit.grc /tmp

But if you tell strace to run it, the command becomes:

strace ln -sf testxmit.grc /tmp

You might want to redirect the output to a file using the shell or the -o option, though. Some commands generate a lot and often the first page or two of output isn’t really what you care about anyway. Continue reading “Linux Fu: Tracing System Calls”