Linux Fu: Shell Scripts In C, C++, And Others

At first glance, it might not seem to make sense to write shell scripts in C/C++. After all, the whole point to a shell script is to knock out something quick and dirty. However, there are cases where you might want to write a quick C program to do something that would be hard to do in a traditional scripting language, perhaps you have a library that makes the job easier, or maybe you just know C and can knock it out faster.

While it is true that C generates executables, so there’s no need for a script, usually, the setup to build an executable is not what you want to spend your time on when you are just trying to get something done. In addition, scripts are largely portable. But sending an executable to someone else is fairly risky — but your in luck because C shell scripts can be shared as… well, as scripts. One option is to use a C interpreter like Cling. This is especially common when you are using something like Jupyter notebook. However, it is another piece of software you need on the user’s system. It would be nice to not depend on anything other than the system C compiler which is most likely gcc.

Luckily, there are a few ways to do this and none of them are especially hard. Even if you don’t want to actually script in C, understanding how to get there can be illustrative.

Continue reading “Linux Fu: Shell Scripts In C, C++, And Others”

Lambdas For C — Sort Of

A lot of programming languages these days feature lambda functions, or what I would be just as happy to call anonymous functions. Some people make a big deal out of these but the core idea is very simple. Sometimes you need a little snippet of code that you only need in one place — most commonly, as a callback function to pass another function — so why bother giving it a name? Depending on the language, there can be more to it that, especially if you get into closures and currying.

For example, in Python, the map function takes a function as an argument. Suppose you have a list and you want to capitalize each word in the list. A Python string has a capitalize method and you could write a loop to apply it to each element in the list. However, map and a lambda can do it more concisely:

map(lambda x: x.capitalize(), ['madam','im','adam'])

The anonymous function here takes an argument x and calls the capitalize method on it. The map call ensures that the anonymous function is called once for each item.

Modern C++ has lambda expressions. However, in C you have to define a function by name and pass a pointer — not a huge problem, but it can get messy if you have a lot of callback functions that you use only one time. It’s just hard to think up that many disposable function names. However, if you use gcc, there are some nonstandard C features you can use to get most of what you want out of lambda expressions.

Continue reading “Lambdas For C — Sort Of”

Tracking Binary Changes: Learn The DIFF-erent Ways Of The ELF

Source control is often the first step when starting a new project (or it should be, we’d hope!). Breaking changes down into smaller chunks and managing the changes between them makes it easier to share work between developers and to catch and revert mistakes after they happen. As project complexity increases it’s often desirable to add other nice to have features on top of it like automatic build, test, and deployment.

These are less common for firmware but automatic builds (“Continuous Integration” or CI) is repetitively easy to setup and instantly gives you an eye on a range of potential problems. Forget to check in that new header? Source won’t build. Tweaked the linker script and broke something? Software won’t build. Renamed a variable but forgot a few references? Software won’t build. But just building the software is only the beginning. [noseglasses] put together a tool called elf_diff to make tracking binary changes easier, and it’s a nifty addition to any build pipeline.

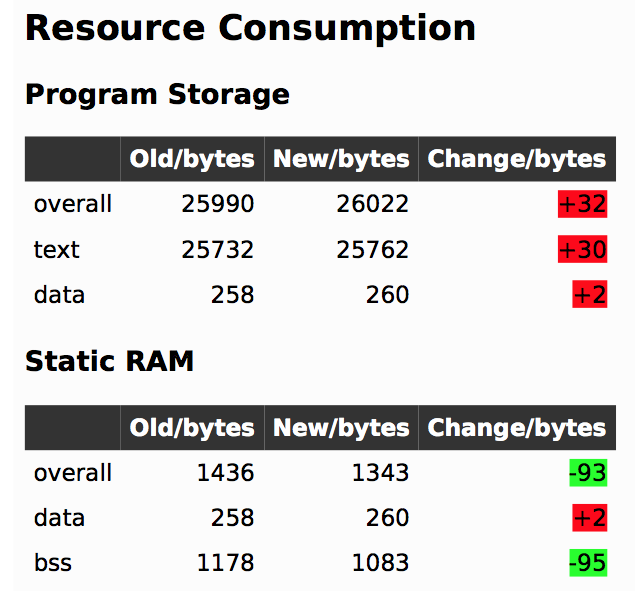
In firmware-land, where flash space can be limited, it’s nice to keep a handle on code size. This can be done a number of ways. Manual inspection of .map files (colloquially “mapfiles”) is the easiest place to start but not conducive to automatic tracking over time. Mapfiles are generated by the linker and track the compiled sizes of object files generated during build, as well as the flash and RAM layouts of the final output files. Here’s an example generated by GCC from a small electronic badge. This is a relatively simple single purpose device, and the file is already about 4000 lines long. Want to figure out how much codespace a function takes up? That’s in there but you’re going to need to dig for it.

elf_diff automates that process by wrapping it up in a handy report which can be generated automatically as part of a CI pipeline. Fundamentally the tool takes as inputs an old and a new ELF file and generates HTML or PDF reports like this one that include readouts like the image shown here. The resulting table highlights a few classes of binary changes. The most prominent is size change for the code and RAM sections, but it also breaks down code size changes in individual symbols (think structures and functions). [noseglasses] has a companion script to make the CI process easier by compiling a pair of firmware files and running elf_diff over them to generate reports. This might be a useful starting point for your own build system integration.

Thanks [obra] for the tip! Have any tips and tricks for applying modern software practices to firmware development? Tell us in the comments!

Quadcopter Uses Bare Metal STM32

[Tim Schumacher] got a Crazepony Mini quadcopter and has been reprogramming it “bare metal” — that is to say he’s programming the STM32 without using an operating system or do-it-all environment. His post on the subject is a good reference for working with the STM32 and the quadcopter, too.

If you haven’t seen the quadcopter, it is basically a PC board with props. The firmware is open source but uses the Keil IDE. The CPU is an STM32 with 64K of program memory. In addition, the drone sports a wireless module, a digital compass, an altimeter, and a gyro with an accelerometer.

Although the post is really about the quadcopter, [Tim] also gives information about the Blue Pill which could be applied to other STM32 boards, as well. On the hardware side, he’s using a common USB serial port and a Python-based loader.

On the software side, he shows how to set up the linker and, using gcc, control output ports. Of course, there’s more to go to work the other peripherals, and Tim’s planning to investigate CMSIS to make that work easier. Our earlier post on STM32 prompted [Wassim] over on Hackaday.io to review a bunch of IDEs. That could be helpful, too.

Crash Your Code – Lessons Learned From Debugging Things That Should Never Happen™

Let’s be honest, no one likes to see their program crash. It’s a clear sign that something is wrong with our code, and that’s a truth we don’t like to see. We try our best to avoid such a situation, and we’ve seen how compiler warnings and other static code analysis tools can help us to detect and prevent possible flaws in our code, which could otherwise lead to its demise. But what if I told you that crashing your program is actually a great way to improve its overall quality? Now, this obviously sounds a bit counterintuitive, after all we are talking about preventing our code from misbehaving, so why would we want to purposely break it?

Wandering around in an environment of ones and zeroes makes it easy to forget that reality is usually a lot less black and white. Yes, a program crash is bad — it hurts the ego, makes us look bad, and most of all, it is simply annoying. But is it really the worst that could happen? What if, say, some bad pointer handling doesn’t cause an instant segmentation fault, but instead happily introduces some garbage data to the system, widely opening the gates to virtually any outcome imaginable, from minor glitches to severe security vulnerabilities. Is this really a better option? And it doesn’t have to be pointers, or anything of C’s shortcomings in particular, we can end up with invalid data and unforeseen scenarios in virtually any language.

It doesn’t matter how often we hear that every piece of software is too complex to ever fully understand it, or how everything that can go wrong will go wrong. We are fully aware of all the wisdom and cliches, and completely ignore them or weasel our way out of it every time we put a /* this should never happen */ comment in our code.

So today, we are going to look into our options to deal with such unanticipated situations, how we can utilize a deliberate crash to improve our code in the future, and why the average error message is mostly useless.

Continue reading “Crash Your Code – Lessons Learned From Debugging Things That Should Never Happen™”

Warnings On Steroids – Static Code Analysis Tools

A little while back, we were talking about utilizing compiler warnings as first step to make our C code less error-prone and increase its general stability and quality. We know now that the C compiler itself can help us here, but we also saw that there’s a limit to it. While it warns us about the most obvious mistakes and suspicious code constructs, it will leave us hanging when things get a bit more complex.

But once again, that doesn’t mean compiler warnings are useless, we simply need to see them for what they are: a first step. So today we are going to take the next step, and have a look at some other common static code analysis tools that can give us more insight about our code.

You may think that voluntarily choosing C as primary language in this day and age might seem nostalgic or anachronistic, but preach and oxidate all you want: C won’t be going anywhere. So let’s make use of the tools we have available that help us write better code, and to defy the pitfalls C is infamous for. And the general concept of static code analysis is universal. After all, many times a bug or other issue isn’t necessarily caused by the language, but rather some general flaw in the code’s logic.

Continue reading “Warnings On Steroids – Static Code Analysis Tools”

Warnings Are Your Friend – A Code Quality Primer

If there’s one thing C is known and (in)famous for, it’s the ease of shooting yourself in the foot with it. And there’s indeed no denying that the freedom C offers comes with the price of making it our own responsibility to tame and keep the language under control. On the bright side, since the language’s flaws are so well known, we have a wide selection of tools available that help us to eliminate the most common problems and blunders that could come back to bite us further down the road. The catch is, we have to really want it ourselves, and actively listen to what the tools have to say.

We often look at this from a security point of view and focus on exploitable vulnerabilities, which you may not see as valid threat or something you need to worry about in your project. And you are probably right with that, not every flaw in your code will lead to attackers taking over your network or burning down your house, the far more likely consequences are a lot more mundane and boring. But that doesn’t mean you shouldn’t care about them.

Buggy, unreliable software is the number one cause for violence against computers, and whether you like it or not, people will judge you by your code quality. Just because Linus Torvalds wants to get off Santa’s naughty list, doesn’t mean the technical field will suddenly become less critical or loses its hostility, and in a time where it’s never been easier to share your work with the world, reliable, high quality code will prevail and make you stand out from the masses.

Continue reading “Warnings Are Your Friend – A Code Quality Primer”