This Week In Security: Apple Backdoors Curl, Tor’s New Bridge, And GhostRace

OK, that headline is a bit of a cheap shot. But if you run the curl binary that Apple ships, you’re in for a surprise if you happen to use the --cacert flag. That flag specifies that TLS verification is only to be done using the certificate file specified. That’s useful to solve certificate mysteries, or to make absolutely sure that you’re connecting to the server you expect.

What’s weird here is that on a MacOS, using the Apple provided curl binary, --cacert doesn’t limit the program to the single certificate file. On an Apple system, the verification falls back to the system’s certificate store. This is an intentional choice by Apple, but not one that’s aimed particularly at curl. The real magic is in Apple’s SSL library, which forces the use of the system keychain.

The current state of things is that this option is simply not going to do the right thing in the Apple provided binary. It’s documented with the note that “this option is supported for backward compatibility with other SSL engines, but it should not be set.” It’s an unfortunate situation, and we’re hopeful that a workaround can be found to restore the documented function of this option. Continue reading “This Week In Security: Apple Backdoors Curl, Tor’s New Bridge, And GhostRace”

This Week In Security: Glibc, Ivanti, Jenkins, And Runc

There’s a fun buffer overflow problem in the Glibc __vsyslog_internal() function. This one’s a real rollercoaster, because logging vulnerabilities are always scary, but at a first look, it seems nearly impossible to exploit. The vulnerability relies on a very long program name, which can overflow an internal buffer. No binaries are going to have a name longer than 1024 bytes, so there’s no problem, right?

Let’s talk about argv. That’s the list of arguments that gets passed into the main() function of every Linux binary when it launches. The first string in that list is the binary name — except that’s a convention, and not particularly enforced anywhere. What really happens is that the execve() system call sets that list of strings. The first argument can be anything, making this an attacker-controlled value. And it doesn’t matter what the program is trying to write to the log, because the vulnerability triggers simply by writing the process name to a buffer.

There is a one-liner to test for a vulnerable Glibc:

exec -a "`printf '%0128000x' 1`" /usr/bin/su < /dev/null

and the Qualys write-up indicates that it can be used for an escalation of privilege attack. The good news is this seems to be a local-only attack. And on top of that, a pair of other lesser severity issues were found and fixed in glibc while fixing this one.
Continue reading “This Week In Security: Glibc, Ivanti, Jenkins, And Runc”

Picture of the miniJen structure on a presentation desk

A Jenkins Demo Stand For Modern Times

Once you’re working on large-scale software projects, automation is a lifesaver, and Jenkins is a strong player in open-source automation – be it software builds, automated testing or deploying onto your servers. Naturally, it’s historically been developed with x86 infrastructure in mind, and let’s be fair, x86 is getting old. [poddingue], a hacker and a Jenkins contributor, demonstrates that Jenkins keeps up with the times, with a hardware demo stand called miniJen, that has Jenkins run on three non-x86 architectures – arm8v (aarch64), armv7l and RISC-V.

There’s four SBCs of different architectures involved in this, three acting as Jenkins agents executing tasks, and one acting as a controller, all powered with a big desktop PSU from Pine64. The controller’s got a bit beefier CPU for a reason – at FOSDEM, we’ve seen it drive a separate display with a Jenkins dashboard. It’s very much a complete demo for its purpose, and definitely an eyecatcher for FOSDEM attendees passing by the desk! As a bonus, there’s also a fascinating blog post about how [poddingue] got to running Jenkins on RISC-V in particular.

Even software demonstrations get better with hardware, and this stood out no doubt! Looking to build a similar demo, or wondering how it came together? [poddingue] has blog posts on the demo’s structure, a repo with OpenSCAD files, and a trove of videos demonstrating the planning, design and setup process. As it goes with continuous integrations, we’ve generally seen hackers and Jenkins collide when it comes to build failure alerts, from rotating warning lights to stack lights to a Christmas tree; however, we’ve also seen a hacker use it to keep their firmware size under control between code changes. And, if you’re wondering what continuous integration holds for you, here’s our hacker-oriented deep dive.

Tracking Binary Changes: Learn The DIFF-erent Ways Of The ELF

Source control is often the first step when starting a new project (or it should be, we’d hope!). Breaking changes down into smaller chunks and managing the changes between them makes it easier to share work between developers and to catch and revert mistakes after they happen. As project complexity increases it’s often desirable to add other nice to have features on top of it like automatic build, test, and deployment.

These are less common for firmware but automatic builds (“Continuous Integration” or CI) is repetitively easy to setup and instantly gives you an eye on a range of potential problems. Forget to check in that new header? Source won’t build. Tweaked the linker script and broke something? Software won’t build. Renamed a variable but forgot a few references? Software won’t build. But just building the software is only the beginning. [noseglasses] put together a tool called elf_diff to make tracking binary changes easier, and it’s a nifty addition to any build pipeline.

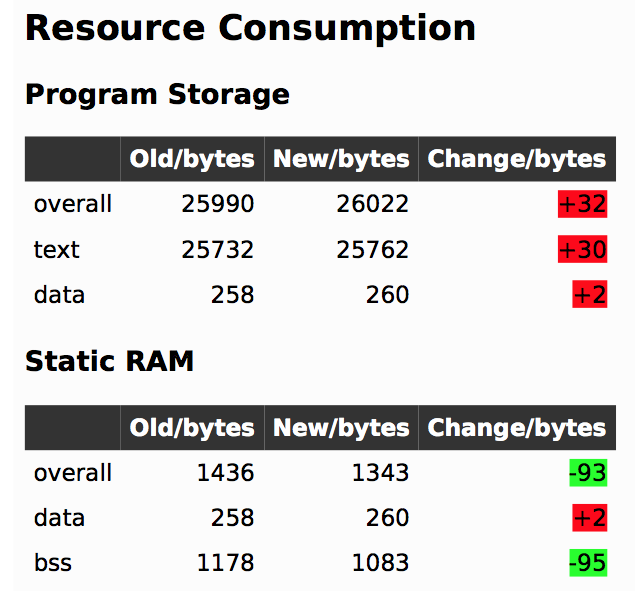
In firmware-land, where flash space can be limited, it’s nice to keep a handle on code size. This can be done a number of ways. Manual inspection of .map files (colloquially “mapfiles”) is the easiest place to start but not conducive to automatic tracking over time. Mapfiles are generated by the linker and track the compiled sizes of object files generated during build, as well as the flash and RAM layouts of the final output files. Here’s an example generated by GCC from a small electronic badge. This is a relatively simple single purpose device, and the file is already about 4000 lines long. Want to figure out how much codespace a function takes up? That’s in there but you’re going to need to dig for it.

elf_diff automates that process by wrapping it up in a handy report which can be generated automatically as part of a CI pipeline. Fundamentally the tool takes as inputs an old and a new ELF file and generates HTML or PDF reports like this one that include readouts like the image shown here. The resulting table highlights a few classes of binary changes. The most prominent is size change for the code and RAM sections, but it also breaks down code size changes in individual symbols (think structures and functions). [noseglasses] has a companion script to make the CI process easier by compiling a pair of firmware files and running elf_diff over them to generate reports. This might be a useful starting point for your own build system integration.

Thanks [obra] for the tip! Have any tips and tricks for applying modern software practices to firmware development? Tell us in the comments!

Jenkins Given An Industrial Stack Light For Build Reporting

When working on software development in a team environment, it’s important to know the status of your build at all times. Jenkins can display build automation info on a screen but where’s the fun in that? A popular office project is to build some kind of visual display of a project’s status, and [dkt01] has done just that with this stack light build monitor.

In this day and age of online shopping, random bits of industrial hardware are just an eBay away, so it’s easy to find some cool lamps or indicators for any project. [dkt01] sourced a standard 24V stack light off the shelf. With its green, red, and yellow indicators, its perfect for showing the current status of their build server.

The project uses an Arduino Pro Micro combined with an ENC28J60 Ethernet adapter. We used to see that chip all the time but in 2017 it’s somewhat of a classic setup with the great unwashed masses largely migrating to the ESP8266. However, for the purposes of this project, it was perfect for connecting to the wired office network (after all, you want to know the status of your build and not of your WiFi). [dkt01] even managed to get a web configuration to work despite the relatively meager resources of the ATmega32u4.

The build is cleanly executed, with the microcontroller and Ethernet hardware tucked into a 3D printed base for the stack light’s enclosure. It’s far more likely to become a permanent office fixture if it’s a tidy build without wires hanging out everywhere so a custom PCB ties everything together neatly. In another nice touch, the stack lights flash on initialization to indicate if the DHCP lease was successful, which makes troubleshooting easier. There’s an overview of all different light combinations and meanings in the video after the break.

Overall it’s a solid build with some off-the-shelf components that serves a genuine purpose. For a similar project built on a smaller scale, check out the Indictron. For something bigger, show us how you’ve learned to output your server status on the city’s traffic lights. Ask first, though.
Continue reading “Jenkins Given An Industrial Stack Light For Build Reporting”

Jenkins Lights The Christmas Tree

Jenkins is open-source automation software that tries to automate parts of the software development process. When you submit code, for example, Jenkins will grab it, build the project with it and run any tests on it. If you have a large number of people submitting new code or data, Jenkins will wait and grab a bunch of the submissions to build. Depending on the size of the project, this can take a while, and if there’s a problem, you need to know quickly so that people aren’t waiting on a broken build. Email’s fine for this, but [dkt01] saw one of the desktop LED Christmas tree projects on Hackaday, and integrated it into his Jenkins system.

Like the other projects, WS2812b LED rings are used as the tree, and an Arduino Pro Mini runs the show, with an Ethernet LAN Module to communicate with the Python script that monitors the Jenkins build job. The Python script sends commands to the Arduino, which in turn lights up the LEDs. They light up green on a successful build and red if something fails, but during the build process, the LEDs show the current state of the build, tracking Jenkins’ progress as it builds.

Our previous Jenkins post used a big, red LED light that would light up if the build failed. [dkt01]’s build lets you know if the build is successful or has failed, but the build progress is a great addition.

Continue reading “Jenkins Lights The Christmas Tree”

Jenkins And Slack Report Build Failure! Light The Beacons!

When you have a large software development team working on a project, monitoring the build server is an important part of the process. When a message comes in from your build servers, you need to take time away from what you’re doing to make sure the build’s not broken and, if it’s broken because of something you did, you have to stop what you’re doing, start fixing it and let people know that you’re on it.

[ridingintraffic]’s team uses Jenkins to automatically build their project and if there’s a problem, it sends a message to a Slack channel. This means the team needs to be monitoring the Slack channel, which can lead to some delays. [ridingintraffic] wanted immediate knowledge of a build problem, so with some software, IoT hardware, and a rotating hazard warning light, the team now gets a visible message that there’s a build problem.

An Adafruit Huzzah ESP8266 board is used as the controller, connected to some RF controlled power outlets via a 434MHz radio module. To prototype the system, [ridingintraffic] used an Arduino hooked up to one of the RF modules to sniff out the codes for turning the power outlets on and off from their remotes. With the codes in hand, work on the Huzzah board began.

An MQTT broker is used to let the Huzzah know when there’s been a build failure. If there is, the Huzzah turns the light beacon on via the power outlets. A bot running on the Slack channel listens for a message from one of the developers saying that problem is being worked on, and when it gets it, it sends the MQTT broker a message to turn the beacon off.

There’s also some separation between the internal network, the Huzzahs, and the Slack server on the internet, and [ridingintraffic] goes over the methods used to communicate between the layers in a more detailed blog post. Now, the developers in [ridingintraffic]’s office don’t need to be glued to the Slack channel, they will not miss the beacon when it signals to start panicking!