Simple Wave Generation In Python (and SciPy)

[153Armstrong] did a short post on how easy it is to generate waveforms using Python. We agree it is simple, but actually, it isn’t so much Python per se, it is some pretty cool libraries (SciPy, in particular) that do all the hard work. That may be splitting hairs, but it is worth nothing that SciPy (pronounced “Sigh Pie”) also does other handy tricks like Fourier transforms, too. You can see a video of his results, below.

The code is simple and one of the commenters pointed out an even more efficient way to write the data to a WAV file. The basic idea is to create an array of samples in a buffer using some features of SciPy’s NumPy component.

Continue reading “Simple Wave Generation In Python (and SciPy)”

Universal Robots Vision-Based LEGO Stacker

[Thomas Kølbæk Jespersen] and his classmates at Aalborg University’s Robot Vision course used MATLAB code and URscript to program a Universal Robots UR5 to stack up Duplo bricks. The Duplo bricks are stacked into low-fi Simpsons characters — yellow for Homer’s head, white for his shirt, and blue for his pants, for example.

The bricks are scattered randomly on a nearby table, while a camera mounted above the table scans the bricks and assists in determining the location, color, and orientation of the elements. This involves blob analysis which helps the computer decide what pixel is part of a brick and what isn’t. After running a recursive grassfire algorithm with 4-connectivity, the computer gives each pixel a number and assigns it to a blob.

To determine the orientation (the bricks are all assumed to be stud-side up and not overlapping) the blob is divided into quadrants and within each quadrant, the distance between the center of the blob and its farthest pixel is measured. This technique is not likely to work as well with a brick that isn’t square. Each brick’s location in pixels is translated into Cartesian coordinates, making it a cinch for the robot to pick it up. See [Thomas]’s GitHub for MATLAB and URscript code.

Looking for more UR5 projects? Check out the Sewbo garment-making robot we published last year.

Continue reading “Universal Robots Vision-Based LEGO Stacker”

MATLAB And Simulink For Zynq

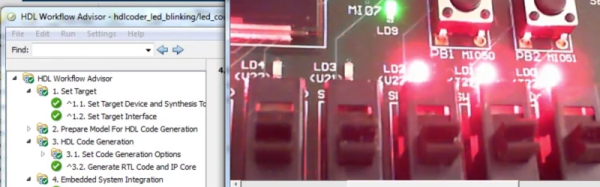
Although we see a lot of MATLAB use in industry and in academia, it isn’t as popular in the hacker community. That’s probably due to the cost. If you’ve ever wondered why companies will pay over $2000 for the base product, you might enjoy the video of a webinar covering using MATLAB and Simulink (a companion product) to program the CPU and FPGA on a Zynq Zedboard. Not interested because of the price? If you aren’t using it for commercial purposes, it isn’t as bad as you think.

MathWorks is one of those companies that likes to market by virtually giving away products to students with the hope that they’ll adopt the same tools when they land jobs in industry. Their flagship product, MATLAB, is well-entrenched in the labs and offices of big corporations. We’ve often thought that MATLAB is sort of what FORTRAN would look like if it had been developed in the last 20 years instead of 60 years ago. It is true that a base license for MATLAB is over $2000. However, if you aren’t using it for commercial purposes, and you can’t score a student license, you can get a personal license of MATLAB for about $150. The extra modules are also similarly reduced in price. If you are a student, the price drops to about $100, although many schools have licenses students can use at no cost to them.

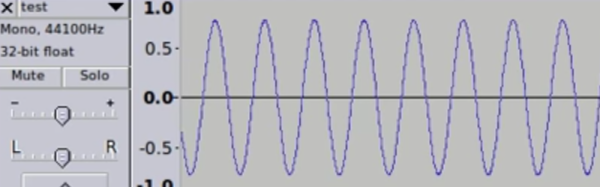
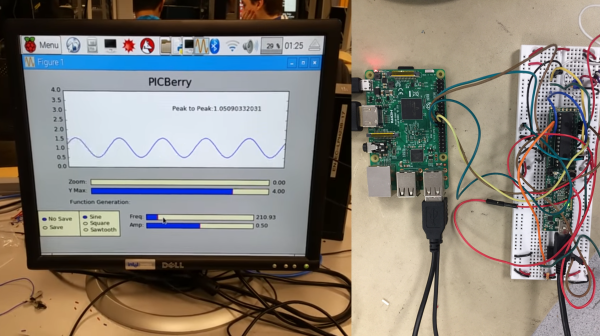
If you watch the video from [Noam Levine], you’ll see you get your money’s worth. If you are wanting to configure the FPGA directly, this isn’t for you. But if you just want to accelerate a program by pushing DSP or other algorithms that can benefit from hardware assistance, MATLAB makes it very easy.

Continue reading “MATLAB And Simulink For Zynq”

Hybrid Raspberry Pi + PIC32 = Oscilloscope And Function Generator

The PicBerry is a student final project by [Advitya], [Jeff], and [Danna] that takes a hybrid approach to creating a portable (and affordable) combination digital oscilloscope and function generator. It’s based on the Raspberry Pi, features an intuitive Python GUI, and can generate and measure simultaneously.

But wait! The Raspberry Pi is a capable little Linux machine, but meeting real-time deadlines isn’t its strong suit. That’s where the hybrid approach comes in. The Pi takes care of the user interface and other goodies, and a PIC32 over SPI is used for 1 MHz sampling and running a DAC at 500 kHz. The idea of combining them into PicBerry is to get the best of both worlds, with the Pi and PIC32 each doing what they are best at. The readings are sent in batches from the PIC32 to the Pi, where the plot is updated every 30 ms so that user does not perceive any visible lag.

The project documentation notes that improvements can be made, the speeds are a far cry from regular bench equipment, and the software lacks some typical features such as triggering, but overall not bad at all for under $50 of parts. In fact, there are hardly any components at all beyond the Raspberry Pi, the PIC32, and a MCP4822 digital-to-analog converter. A short demo video is embedded below.

Continue reading “Hybrid Raspberry Pi + PIC32 = Oscilloscope And Function Generator”

Tutorial On Signal Processing In Linux With Octave

If you’ve taken any digital signal processing classes at a college or university, you’ve probably been exposed to MATLAB. However, if you want to do your own work, you might think about Linux and one of the many scientific computing applications available for it.

[David Duarte] recently published a three-part tutorial on using Octave to do scientific audio processing. The first part covers basic reading, writing, and playing of audio files. Part two covers synthesis of signals, plotting, and some basic transformations.  Modulation is the topic of the third part. If you prefer your tutorials on video, you can check out the video below.

We’ve talked about MATLAB before in the context of message cracking. Then again, some of the best signal processing is done by humans. If you don’t like Octave, you might try Scilab, another Linux package that is similar. There’s also Freemat, Sage, and Spyder. Of course, you can also run MATLAB under Linux.

Visualizing The Fourier Transform

If you do any electronics work–especially digital signal processing–you probably know that any signal can be decomposed into a bunch of sine waves. Conversely, you can generate any signal by adding up a bunch of sine waves. For example, consider a square wave. A square wave of frequency F can be made with a sine wave of frequency F along with all of its odd harmonics (that is, 3F, 5F, 7F, etc.). Of course, to get a perfect square wave, you need an infinite number of odd harmonics, but in practice only a few will do the job.

Like a lot of abstract concepts, it is easy to understand the basic premise and you could look up any of the mathematical algorithms that can take a signal and perform a Fourier transform on it. But can you visualize why the transform works the way it does? If you can’t (or even if you can), you should check out [Mehmet’s] MATLAB visualization of harmonic circles. If you don’t have MATLAB yourself, you can always check out the video (see below).

Continue reading “Visualizing The Fourier Transform”

Using MATLAB And SDR To Reverse Engineer 433MHz Messages

Hackers everywhere are having a lot of fun with SDR – as is obvious from the amount of related posts here on Hackaday. And why not, the hardware is cheap and easily available. There are all kinds of software tools you can use to dig in and explore, such as SDR# , Audacity, HDSDR and so on. [illias] has been following SDR projects for a while, which piqued his interest enough for him to start playing with it. He didn’t have any real project in mind so he focused on studying the methodology and the tools available for analyzing 433MHz RF transmission. He describes the process of using MATLAB to recover the transmissions being received by the SDR

He started off by studying the existing tools available to uncover the details of the protocol. The test rig uses an Arduino UNO with the rc-switch library to transmit via a common and inexpensive 433MHz module. SDR# is used to record the transmissions and Audacity allows [illias] to visualize the resulting .wav files. But the really interesting part is where he documents the signal analysis using MATLAB.

He used the RTL-SDR package in conjunction with the Communications System Toolbox to perform spectrum analysis, noise filtering and envelope extraction. MATLAB may not be the easiest to work with, nor the cheapest, but its powerful features and the fact that it can easily read data coming from the SDR makes it an interesting tool. For the full skinny on what this SDR thing is all about, check out Why you should care about Software Defined Radio.