A Simple Seismometer You Can Build Yourself

If you’re a child, there are certain things you’re taught even though they’re probably not directly relevant to your life. We teach young kids all about dinosaurs, and we teach older kids all about how the mitochondria is the powerhouse of the cell. We also teach kids about natural phenomena like earthquakes, and the equipment used to measure them. Namely, seismometers. You might like to satisfy your own child-like curiosity by building one of your own, like [mircemk] did.

Output from the build showing tremors in the Earth.

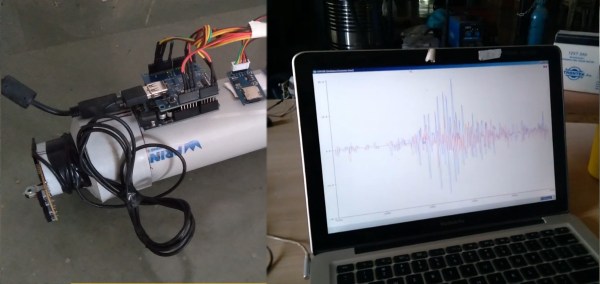
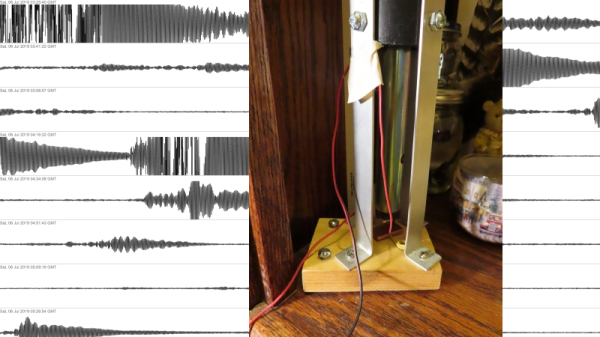
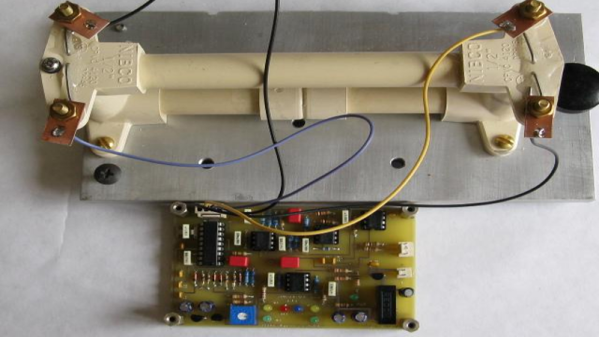
The build starts with a sensitive geophone of [mircemk’s] own design. That’s basically a microphone but it’s for picking up vibrations in the ground, not in the air. However, a geophone is not enough. You need to be able to pick up the signals from the geophone and then plot them if you want a seismometer.

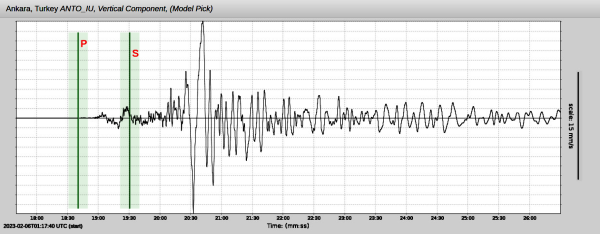
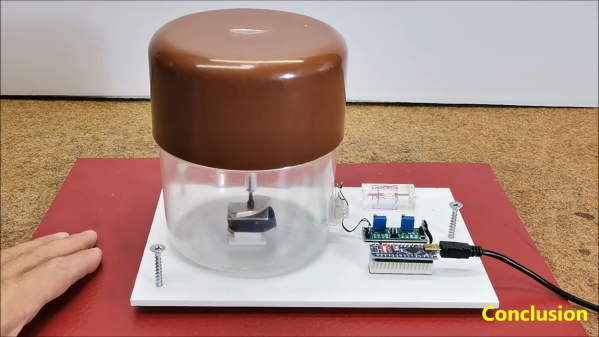
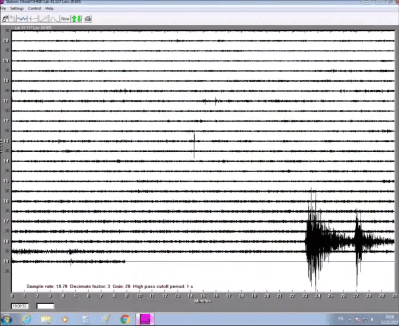
First, the signals from the geophone must be amplified, which is achieved with a small circuit based around the LM358 op-amp. From there, the signal is sent to an Arduino where the output is captured via the analog-to-digital converter. This passes the signal to an attached PC which plots the results using a piece of software called NERdaq, which was developed for schools that built their own slinky-based seismometers.

[mircemk] reports that this setup has served as a reliable tool for visualizing earthquake activity for over 6 years. Though, it bears noting, it’s not calibrated so don’t expect to get science grade results out of it. Regardless, though, it’s a super cool way to understand more about what is going on with the geology around us. Video after the break.

Continue reading “A Simple Seismometer You Can Build Yourself”

Ask Hackaday: Incidental Earthquake Detection

It never seems to fail: at the very moment that human society seems to reach a new pinnacle of pettiness, selfishness, violence, and self-absorption, Mother Nature comes along and reminds us all who’s really in charge. The obvious case in point here is the massive earthquakes near the border of Turkey and Syria, the appalling loss of life from which is only now becoming evident, and will certainly climb as survivors trapped since the Monday quakes start to succumb to cold and starvation.

Whatever power over nature we think we can wield pales by comparison with the energy released in this quake alone, which was something like 32 petajoules. How much destruction such a release causes depends on many factors, including the type of quake and its depth, plus the soil conditions at the epicenter. But whatever the local effects on the surface, quakes like these have a tendency to set the entire planet ringing like a bell, with seismic waves transmitted across the world that set the needles of professionally maintained seismometers wiggling.

For as valuable as these seismic networks are, though, there’s a looser, ad hoc network of detection instruments that are capable of picking up quakes as large as these from half a planet away. Some are specifically built to detect Earth changes, while some are instruments that only incidentally respond to the shockwaves traveling through the planet. And we want to know if this quake showed up in the data from anyone’s instruments.

Continue reading “Ask Hackaday: Incidental Earthquake Detection”

The Hunt For The Voice Of Utah’s Arches

Double O Arch. Click to hear!

In the 1990 movie The Hunt For Red October, a stealth submarine is located by what a computer thinks are seismic sounds, but when sped up, they are clearly mechanical. We won’t spoil it further on the off chance that you haven’t seen. We can’t help but wonder if [Prof. Jeff Moore] and his team at the University of Utah were inspired by the movie. Why so? Because they have taken the seismic vibrations of the beautiful arches in Utah, US and sped them up 25 times, placing them right in the range of human hearing on their Red Rock Tones website. Go have a quick listen. We’ll be right here.

The resulting sound bites are just beautiful, and some of them have an almost eerie underwater tone to them as if driven along by a clandestine propulsion system. But that might just be our imagination running away a bit. That’s likely the point of this scientific exercise, however- taking raw scientific data and making it accessible and somehow relevant to even non-geologists.

The Dynamics of Rock Arches All Images Courtesy Prof Jeff Moore

[Prof Moore] and his team aren’t just placing seismometers on natural rock arches for the fun of it, even though that does sound like some fun. Instead, they are studying the natural resonances of these rock formations- both the primary frequencies and the harmonics. By monitoring changes in their resonant frequencies over time, they gain an understanding of how the rock is changing- especially as it relates to the impact that humans have on these natural wonders.

What’s more, these audible representations of seismic waves are something that may be possible for the determined hacker. We’ve featured several DIY seismometers such as this hacked USB mouse designed to detect elephants on the move. Could it be sensitive enough for measuring seismic activity? Try it out, and let us know!

Special thanks to [Prof. Jeff Moore] for permission to use the images for this article.

USB Mouse Hack For Pachyderm Protection

When most of us think of seismometers, our minds conjure up images of broken buildings, buckled roads, and search and rescue teams digging through rubble. But when [Subir Bhaduri] his team were challenged with solving real world problems as frugally as possible as part of the 2020 Frugal Science course, he thought of farmers in rural India for whom losing crops due to raiding elephants is a reality. Such raids can and have caused loss of life for humans and elephants alike. How could he apply scientific means to prevent such conflicts, and do it on the cheap?

Whether inspiration came from using a computer mouse with the cursor speed turned up to “orbital velocity” is debatable, but [Subir] set forth to find out if such sensitivity could be leveraged for the seismic detection of the aforementioned elephants. His proof of concept is a fantastically frugal low cost seismograph using an optical mouse and some cheap PVC pipe and fittings.

We invite you to watch the video below the break to find out how it works. You’ll be impressed as we were by [Subir]’s practical application of engineering principles. And keep your eyes open for the beautiful magnetic damper hack. It’s a real treat!

If pontificating pesky pachyderms p-waves piques your interest, perhaps you’ll appreciate previous projects which produce data with piezo pickups and plumbing parts.

Continue reading “USB Mouse Hack For Pachyderm Protection”

Simple Seismic Sensor Makes Earthquake Detection Personal

When an earthquake strikes, it’s usually hard to miss. At least that’s the case with the big ones; the dozens or hundreds of little quakes that go largely unnoticed every day are interesting too, and make sense to track. That’s usually left to the professionals, with racks of sensitive equipment and a far-flung network of seismic sensors. That doesn’t mean you can’t keep track of doings below your feet yourself, with something like this DIY seismograph.

Technically, what [Alex] built is better called a “seismic detector” since it’s not calibrated in any way. It’s just a simple sensor for detecting ground vibrations, whether they be due to passing trucks or The Big One. [Alex] lives in California, wedged between the Hayward, Calaveras, and San Andreas faults in San Jose, so there is plenty of opportunity for testing his device. The business end is a simple pendulum sensor, with a heavy metal bob hanging from a long wire inside a length of plastic pipe. Positioned close to the bob is a copper plate; the bob and the plate form an air-dielectric variable capacitor that controls the frequency of a simple 555 oscillator. The frequency is measured by a PIC microcontroller and sent to a Raspberry Pi, which displays the data on a graph. You can check in on real-time seismic activity in San Jose using the link above, or check out historical quakes, like the 7.1 magnitude Ridgecrest quake in July. [Alex]’s sensor is sensitive enough to pick up recent quakes in Peru, Fiji, and Nevada, and he even has some examples of visualizing the Earth’s core using data from the sensor. How cool is that?

We’ve seen other seismic detectors before, like this piezo-based device, or even one made from toilet parts. We like the simplicity of the capacitive sensor [Alex] used, though.

Watch Earthquake Roll Across A Continent In Seismograph Visualization Video

If your only exposure to seismologists at work is through film and television, you can be forgiven for thinking they still lay out rolls of paper to examine lines of ink under a magnifying glass. The reality is far more interesting in a field that has eagerly adopted all available technology. A dramatic demonstration of modern earthquake data gathering, processing, and visualization was Tweeted by @IRIS_EPO following a central California quake on July 4th, 2019. In this video can see the quake’s energy propagate across the continental United States in multiple waves of varying speed and intensity. The video is embedded below, but click through to the Twitter thread too as it has a lot more explanation.

The acronym IRIS EPO expands out to Incorporated Research Institutions for Seismology, Education and Public Outreach. We agree with their publicity mission; more people need to know how cool modern seismology is. By combining information from thousands of seismometers, we could see forces that we could not see from any individual location. IRIS makes seismic data available to researchers (or curious data science hackers) in a vast historical database or a real time data stream. Data compilations are presented in several different forms, this particular video is a GMV or Ground Motion Visualization. Significant events like the 4th of July earthquake get their own GMV page where we can see additional details, like the fact this visualization compiled data from 2,132 stations.

If this stirred up interest in seismology, you can join in the fun of networked seismic data. A simple seismograph can be built from quite humble components, but of course there are specially designed chips for the task as well.

Continue reading “Watch Earthquake Roll Across A Continent In Seismograph Visualization Video”

Build A Seismometer Out Of Plumbing Parts

For those outside the rocking and rolling of California’s tectonic plate, earthquakes probably don’t come up on a daily basis as a topic of conversation. Regardless, the instrument to measure them is called a seismometer, and it’s entirely possible to build one yourself. [Bob LeDoux] has shared his article on how to build a Fluid Mass Electrolytic Seismometer, and it’s an impressive piece of work.

This is an instrument which works very differently from the typical needle-and-graph type seen in the movies. Fluid is held in a sealed chamber, with a restricted orifice in the center of a tube. The fluid level is monitored at each side of the orifice. When motion occurs, fluid levels change at either side which allows seismic activity to be measured.

Hooked up to some basic analog electronics, in this form, the device only shows instantaneous activity. However, it would be trivial for the skilled maker to hook this up to a datalogging setup to enable measurements to be plotted and stored. The entire project can be built with simple hand tools and a basic PCB, making it highly accessible.

It’s not the first time we’ve seen a seismometer, either – the Raspberry Shake project is a distributed network of sensors running on the Raspberry Pi.