Astro Pi Mk II, The New Raspberry Pi Hardware Headed To The Space Station

Back in 2015, European Space Agency (ESA) astronaut Tim Peake brought a pair of specially equipped Raspberry Pi computers, nicknamed Izzy and Ed, onto the International Space Station and invited students back on Earth to develop software for them as part of the Astro Pi Challenge. To date, more than 50,000 young people have had their code run on one of the single-board computers; making them arguably the most popular, and surely the most traveled, Raspberry Pis in the solar system.
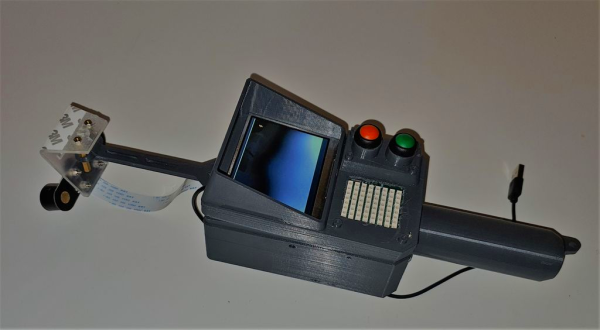
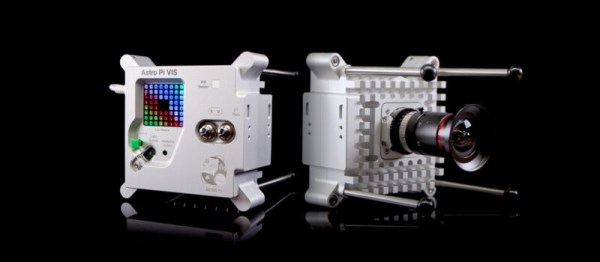
While Izzy and Ed are still going strong, the ESA has decided it’s about time these veteran Raspberries finally get the retirement they’re due. Set to make the journey to the ISS in December aboard a SpaceX Cargo Dragon, the new Astro Pi MK II hardware looks quite similar to the original 2015 version at first glance. But a peek inside its 6063-grade aluminium flight case reveals plenty of new and improved gear, including a Raspberry Pi 4 Model B with 8 GB RAM.

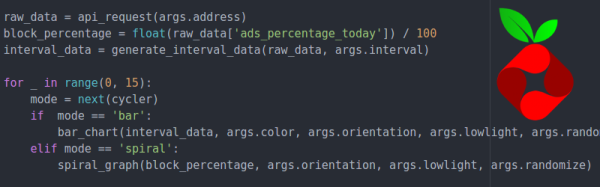
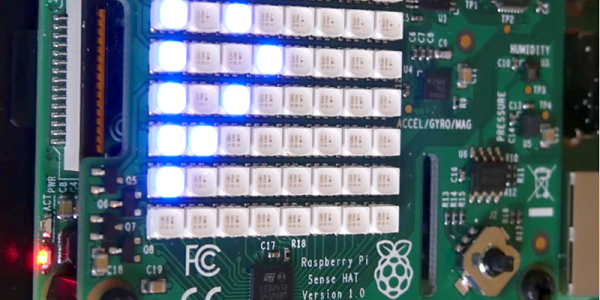
The beefier hardware will no doubt be appreciated by students looking to push the envelope. While the majority of Python programs submitted to the Astro Pi program did little more than poll the current reading from the unit’s temperature or humidity sensors and scroll messages for the astronauts on the Astro Pi’s LED matrix, some of the more advanced projects were aimed at performing legitimate space research. From using the onboard camera to image the Earth and make weather predictions to attempting to map the planet’s magnetic field, code submitted from teams of older students will certainly benefit from the improved computational performance and expanded RAM of the newest Pi.

As with the original Astro Pi, the ESA and the Raspberry Pi Foundation have shared plenty of technical details about these space-rated Linux boxes. After all, students are expected to develop and test their code on essentially the same hardware down here on Earth before it gets beamed up to the orbiting computers. So let’s take a quick look at the new hardware inside Astro Pi MK II, and what sort of research it should enable for students in 2022 and beyond.

Continue reading “Astro Pi Mk II, The New Raspberry Pi Hardware Headed To The Space Station”

Bust Your Own Ghosts With A PKE Meter

You know, we wouldn’t be that surprised if aliens or ghosts show up for real before this year is out. If paranormal becomes part of the new normal, it might be nice to have a PKE meter that can detect spirits and help get a head start on figuring out what they want from us.

Yes, that’s right — instead of just lighting up whenever ghosts are near, [starscream205]’s meter goes the extra yard and translates spiritual energy into English words that scroll across the LED matrix. Inside is a Raspberry Pi 3B+ and a sense HAT, which takes spatial and environmental readings and assigns different words based on the results.

Now [starscream205] can go fearlessly into the night, guided by the night vision camera on the end, and watch for ghosts on the screen. Instead of a typical Pi-compatible screen, this is from a car back-up camera system and has been modified to work with the Pi.

We’ve seen a few PKE meters around here before, but they usually do things such as detect radiation. It’s nice to see one that’s faithful to the original purpose.

Visualizing Blocked Ads With The Pi Sense Hat

Pi-hole is an open source project to turn that Raspberry Pi collecting dust in your drawer into a whole-network ad blocking appliance. Not only does it stop ads from showing up on all your computers and mobile devices, it also keeps track of how many ads have been blocked and where they came from. Just in case you wanted to know how many thousands of ads you missed out on for a given time period.

While the graphs generated in the web interface of Pi-hole are slick and all, what if you just wanted a quick way of visualizing how effective your ad blocking system is? You’re not so much worried about the exact figures, you just want something to blink away on your desk and let you know all those ads are going to /dev/null. Enter the aptly named pi-hole-visualizer by [simianAstronaut].

With the addition of a Sense HAT to the Pi running the ad blocking, this Python script will generate an animated visualization that can be easily interpreted even from a distance. The primary display is a bar graph of DNS traffic, where the height and color of each column indicate relative activity within a specific time interval. A second screen shows a spiral graph which gives you an idea of what percentage of ads were blocked before they hit your devices.

An array of options can be given to the script from the command line; controlling both physical aspects of the display like orientation and LED brightness, as well the configurable parameters for the different available visualizations. As an added bonus, there’s also support for using the Sense HAT joystick to switch between modes interactively.

Turning the Raspberry Pi into an ad blocking appliance goes back to the olden days of the original Raspberry Pi, but it’s interesting to see how advanced the concept has become. Just remember, not all ads are bad.

Sense Hat Comes Alive

Remember the Raspberry Pi Sense Hat? Originally designed for a mission to the International Space Station, the board has quite a few sensors onboard as well as an 8×8 RGB LED matrix. What can you do with an 8×8 screen? You might be surprised if you use [Ethan’s] Python Sense Hat animation library. You can get the full visual effect in the video below.

The code uses an array to represent the screen, which isn’t a big deal since there are only 64 elements. Turning on a particular element to animate, say, a pong puck, isn’t hard with or without the library. Here’s some code to do it with the library:

for x in range(0,7):
 ect.cell(image,[0,x],[randint(0,255), randint(0,255), randint(0,255)],0.1)
 ect.cell(image,[0,x],e,0.1)
for x in range(7,0, -1):
 ect.cell(image,[0,x],[randint(0,255), randint(0,255), randint(0,255)],0.1)
 ect.cell(image,[0,x],e,0.1)

Each loop draws a box with a random color and then erases it before going to the next position. The second for loop makes the puck move in the opposite direction. You can probably deduce that the first argument is the screen array, the second is the position. The third argument sets the color, and the final argument sets an animation timer. Looking at the code, though, it does look like the timer blocks which is probably not going to work for some applications.

If that’s all there was, this wouldn’t be worth too much, but you can also draw triangles, circles, and squares. For example:

ect.circle(image,(4,4), 3, [randint(0,255), randint(0,255), randint(0,255)], 0.1)

We covered the Sense Hat awhile back. Of course, it does a lot more than just light up LEDs as you can see from this weather dashboard.

Continue reading “Sense Hat Comes Alive”

Raspberry Pi Sense HAT Super Weather Dashboard

[InitialState] posted a great multipart tutorial about building what he calls a “Hyper-local Weather Dashboard.” In plain language, he created a Raspberry Pi-based web page that fuses weather data from Wunderground along with locally sensed weather data.

The tutorial has thee parts. The first part covers reading data from Wunderground using their developer’s API (you’ll need an API key; a free one is good for 500 queries a day). The second part covers using the Pi Sense HAT to measure local temperature, humidity, and pressure. The final part ties it all together using producing the hyper-local weather dashboard (whatever that really means).

We talked about the Sensor HAT earlier (and there’s more info in the video, below). Seems like those lights could do something, although that wouldn’t do you any good over a web interface. This is a good-looking project (and tutorial) and easy enough that it would be a good place to start
experimenting with the Raspberry Pi.

Continue reading “Raspberry Pi Sense HAT Super Weather Dashboard”