If there’s one thing that Hollywood knows about hackers, it’s that they absolutely love data visualizations. Sometimes it’s projected on a big wall (Hackers, WarGames), other times it’s gibberish until the plot says otherwise (Sneakers, The Matrix). But no matter what, it has to look cool. No hacker worth his or her salt can possibly work unless they’ve got an evolving Venn diagram or spectral waterfall running somewhere in the background.
Inspired by Hollywood portrayals, specifically one featured in Avengers: Age of Ultron, [Zack Akil] decided it was time to secure his place in the pantheon of hacker wall visualizations. But not content to just show meaningless nonsense on his wall, he set out to create something that was at least showing actual data.
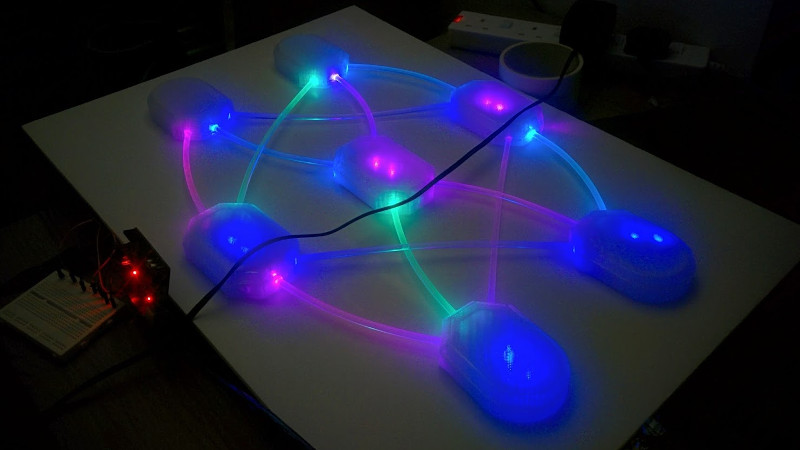
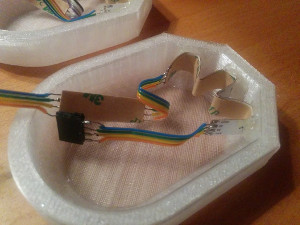 [Zack] created a neural network to work through multi-label classification data in Python using the scikit-learn machine learning suite. The code takes the values from the neutral network training algorithm and converts them to RGB colors by way of an Arduino. Each “node” in the neutral network is 3D printed in translucent filament, and fitted with an RGB LED module. These modules are then connected to each other via side-glow fiber optic tubes, so that the colors within the tubes are mixed depending on the colors of the nodes they are attached to. This allows for a very organic “growing” effect, as colors move through the network node-by-node.
In the end this particular visualization doesn’t really mean anything; the data it’s working on only exists for the purposes of the visualization itself. But [Zack] succeeded in creating a practical visualization of machine learning, and if you’re the kind of person who needs to keep tabs on learning algorithms, some variation of this design may be just what you’re looking for.
If AI isn’t your thing but you still want a wall of RGB LEDs, maybe you can use this phased array antenna visualizer instead. If you’re really hip, maybe you’ll go the analog route and put a big gauge on the wall.


I really wish GIF89a hadn’t seen the light of day… animations amongst text is too distracting to read, so I have animations turned off most of the time as otherwise they just play automatically, unlike HTML5 video which will only play when clicked.
That cute GIF is 4MB… as an MPEG1 video it is less than 1MB.
ahh… the large distracting GIF irritation made another victim. No need to complain… or better sad, it’s useless to complain here. Hackaday keeps these nasty (but sometimes pretty looking) animations coming, again and again. No matter how many people hate it.
For the pro-gif people (with lot’s of bandwith and time to spare): claiming that lot’s of other sites (feel free to name a few) do this as well doesn’t make it right, faster loading or less annoying, does it?
Maybe we all should start browsing using something like elinks. All the meat with none of the fat.
Yah, seriously, if you don’t like graphics, you’re using the wrong browser, don’t rage at other ppl for your mistakes.
Yeah… I’m not against graphical things… just feel that GIF is obsolete and ill-suited to the task for the reasons I’ve already outlined.
I don’t mind the lone gif here and there, but some sites definitely take it too far. I’m looking at you, Adafruit
Or, get yourself a decent browser and configure it to stop GIFs from autoplaying: http://kb.mozillazine.org/Animated_images
maybe a lot of hackaday readers are still using IE6….
I find that incredible. Maybe a lot of other retro browsers, but the ugly duckling known as IE6, I somewhat doubt.
In fact, thinking about it, pretty sure if you create an object tag with a content-type of
video/mpeg… IE6 (and perhaps earlier) would probably whistle up Windows Media Player to handle it. That is, it’d work as expected.I find it a bit amusing that an article that claims hackers love dataviz on site claimed to be aimed at hackers have only comments complaining about the animated viz.
Now this is not to be taken as a complaint nor reflection about hackadays target audience. I just got a good laugh and wanted to share. Surely others must have thought similar as well.
The visualisation is great… its presentation on this website though, not so great. The last 27 years has given us many ways to capture and distribute this cool visualisation, why choose the one that’s limited to 8-bit colour and lacks inter-frame encoding?
At least the GIF doesn’t suffer from inter-frame encoding distortion:
Great example is of those videos of ,say, a heavy wind blowing a tree around,
what happens is parts of the picture moving around too fast is mistaken as static-noise and thus gets encoded as a still picture, now you have an unintelligible static blur.
Seen enough badly encoded videos to know this, some are badly encoded straight from the CCD before it is even written to the cameras’ storage(AKA Potato cam).
Good to hear it amuses you but when you posted your comment, there were only six posted comments. Now I’m sure you’ll understand that hackaday has more the 6 people visiting their pages. So please hang on for a few more days to see where the discussions (on this page) are actually going…
Personally my first thought about this project was… oooooohhhh nice colors… and whooooohhh shiny lights. Which is not the only experience the builder of this project was going for I’m sure, but it sure looks pretty and makes a nice display.
Unfortunately I would like to say that hackaday articles get rather few comments and alot of them tend to be about something other than the project covered by the article ( just like my own ).
But the main thing that got me laughing was that the article seemed to have hit spot on when the target audience right away starts a debate on the viz topic. Unfortunately not about the project but it still shows that it’s something cares about deeply.
I very much agree on the oooh it’s shiny part. Got a really nice blinkenlights feel to it.
Hackers aren’t the only one’s that love data visualization. Business majors apparently with their dashboards, and other graphs. And let’s not get into all the pretty that scientists do. But my favorite because few seem to get it right is GUIs, especially of the scifi variety.
neat project — really beautiful visualizations. yay for tabletop neural networks!
A while ago, at Black Hat, there was this presentation about a soft that makes great binary visualizations, ..cantor.dust.
https://www.youtube.com/watch?v=4bM3Gut1hIk
There was a demo included inside the software package you could download (and attendee had on CD), but I never heard of it afterward, their site ( https://sites.google.com/site/xxcantorxdustxx ) seems abandoned…
If someone know if it became something of have been forked (it was not open source), please let us know.
But how long before we can jack in and fly around inside it?
Link for the demo:
https://media.blackhat.com/bh-us-12/Arsenal/Domas/_cantor.dust_.7z.zip
(requires windows with DX9 and some other stuff)
Looks like something one would see in one of those hacking games.