
Everyone wants to know what the weather is, and what it is going to be. Today’s internet enabled forecasts give us continuous streams of current weather data and predictions from any of several computer models. Couple that with data from an on-site station, and you’ve got a lot of information to display! It makes sense that weather display projects would be popular with hackers, makers and engineers. What do you do after you build the worlds most awesome clock? Build the worlds most awesome weather display (and then incorporate a clock in there as well!).
Last week on The Hacklet I mentioned that there are two basic types of weather projects on Hackaday.io: Sensing and Display projects. There was a bit of foreshadowing there, as this week’s Hacklet covers some of the best weather display projects on Hackaday.io!
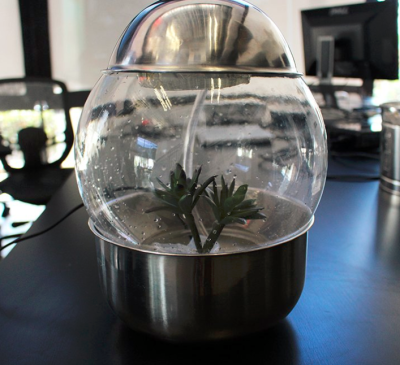 We start with [Ashley Hennefer] and G.E.O, a project which is out of this world – literally. Geological Environment Observer, or G.E.O was created for NASA’s Space Apps Challenge. G.E.O’s mission is to keep astronauts on long-distance space flight missions connected with their home city (and planet). An astronaut programs the device with their home city and G.E.O takes it from there. Inside a glass globe, G.E.O creates weather patterns mirroring the programmed city. It does this with Adafruit NeoPixel LEDs, a water pump, a mist generator, and a wave shield. An Intel Edison controls the system. For now, weather data and programming are completed using a web interface. Once G.E.O launches though, data will be streamed via NASA’s deep space network.
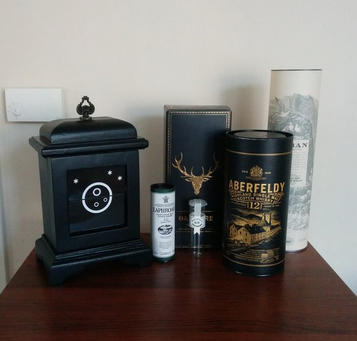 [Sephen DeVos] keeps track of the weather with a glance at his Internet Split Flap Weather Clock. Lots of weather apps use simple icons to display the current conditions. [Sephen] placed those icons on a mechanical split flap display which lets him know the conditions outside. The project’s case came from a donor clock given to [Sephen] by his parents. He then 3D printed an entire split flap mechanism, including the gears! Each 50 mm x 100 mm flap forms half an image. A small stepper drives the flaps, while an IR detector lets the system know when it has reached a home position. Control is handled by an Arduino Nano and companion Ethernet shield. The Arduino checks the weather every 30 minutes. If conditions have changed, it flips to the right icon. Genius!
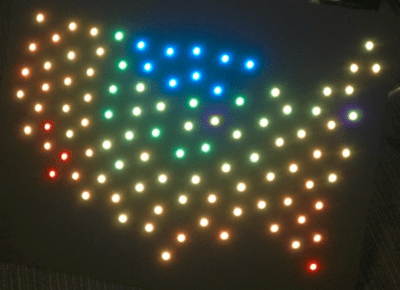 [Dan Fein] is keeping track of the temperature across the entire USA with Weather Map. [Dan] works for Weather Underground, so it’s no surprise that he uses their API (accessed via a node.js script) for weather data. The data is fed into a spark core which then drives a string of 100 WS2812 LEDs. Each LED is mapped to a specific point in the continental USA. Color indicates the current temperature at that location. [Dan] does caution that you’ll have to slow down access to Weather Underground if you’re using a free API key. Even with slower updates, this is still an awesome project!
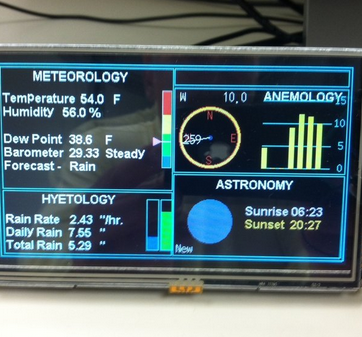 [Jeff Thomas] went the traditional route with YAWS – (Yet Another Weather Station). YAWS uses a 5 inch TFT LCD to display weather data from a number of sensors. [Jeff] got his display and the driver board from buydisplay.com. The driver board uses the venerable RA8875 display driver chip. The RA8875 handles all the hard parts of driving an LCD, like video RAM, refresh, and clocks. This allows a relatively slow Arduino to drive all those pixels. [Jeff] created a very handsome interface to display all his data, but he has a small problem – a memory leak causes the system to freeze up every 18 hours! We’re hoping [Jeff] will share his source code so the Hackaday.io community can help him find that pesky bug!
If you want to see more projects like these, check the Weather Display Projects list on Hackaday.io. That’s it for this week’s Hacklet, As always, see you next week. Same hack time, same hack channel, bringing you the best of Hackaday.io!


“The data is fed into a spark core which then … ”
Note that the spark core (or Spark Core) is now the Particle Core (https://www.particle.io/). 8^)
Stats are just that, static. No game play in action just the score.
Radar. Here it comes, or not and when.
It would be cool to have such on a graphic display in an attractive manner. The section from which the wind usually comes from leading to home. This better than seeing half of a local radar as history.