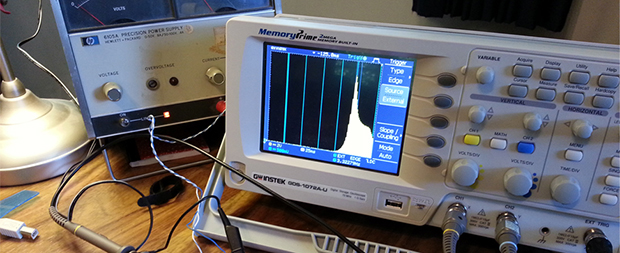
Bode plots – or frequency response graphs – are found in just about every piece of literature for high-end audio equipment. It’s a simple idea, graphing frequency over amplitude, but making one of these graphs at home usually means using a soundcard, an Excel spreadsheet and a multimeter, or some other inelegant solution. Following a neat tutorial from [Dave Jones], [Andrew] came up with a very simple way to make a Bode plot in real-time with an oscilloscope, a microcontroller, and a few off-the-shelf parts.
The basic idea behind [Dave Jones]’ impromptu Bode plotter is to configure a frequency generator to output a sine wave that ramps up over a period of time. Feed this sine wave through a filter, and you have amplitude on the vertical axis of your ‘scope and frequency on the horizontal axis. Boom, there’s your Bode plot.
[Andrew] did [Dave] one better by creating a small circuit with an Arduino and an AD9850 sine wave generator. Properly programmed, the AD9850 can ramp up the frequency of a sine wave with the Arduino outputting sync pulses every decade or octave of frequency, depending if you want a linear or log Bode plot.
It’s a nifty little tool, and when it comes to building test equipment from stuff that just happens to by lying around, we’ve got to give it up for [Andrew] for his really cool implementation.