How do you tell how much load is on a CPU? On a desktop or laptop, the OS usually has some kind of gadget to display the basics. On a microcontroller, though, you’ll have to roll your own CPU load meter with a few parts, some code, and a voltmeter.
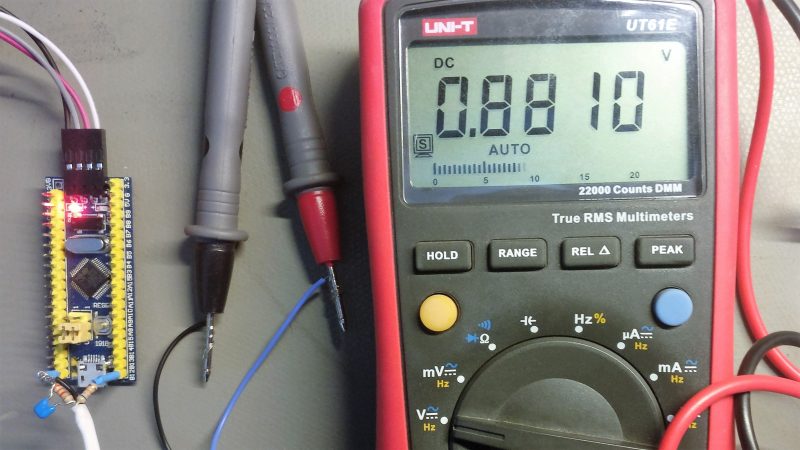
We like [Dave Marples]’s simple approach to quantifying something as complex as CPU load. His technique relies on the fact that most embedded controllers are just looping endlessly waiting for something to do. By strategically placing commands that latch an output on while the CPU is busy and then turn it off again when idle, a PWM signal with a duty cycle proportional to the CPU load is created. A voltage divider then scales the maximum output to 1.0 volt, and a capacitor smooths out the signal so the load is represented by a value between 0 and 1 volt. How you display the load is your own choice; [Dave] just used a voltmeter, but anything from an LED strip to some kind of audio feedback would work too.
Still just looking for a load meter for your desktop? Take your pick: an LED matrix, old-time meters, or even Dekatrons.


This sort of thing also works for measuring latency and response times and the like. I needed to prove that my latest design GPS clock lived up to its accuracy specification. So I set an unused GPIO pin high at the end of the PPS ISR and then set it low at some convenient point in the main loop around 500 ms into the second. By putting the unused GPIO and the PPS on a scope I could measure exactly how long that took – in this case 70 µs. Add 100 µs worst case display refresh time and I was under the 200 µs spec. And there was much rejoicing.
Neat! You can get LED 7-segment voltmeter modules for pretty cheap from the usual sources that would probably be great for this.
Yeah, pretty common way to do CPU profiling. On bare metal or lower level platforms GPIO writes don’t take too much overhead (an instruction or two – though it may mangle compiler optimizations and make things a little more complicated). As an extension, this is a great use of a logic analyzer – you can use different GPIO writes around function calls and measure how much CPU time different parts of your code are taking all at the same time. I’ve been using this technique extensively to improve performance of some of my embedded code. Might even find some surprises about where all your CPU time is going.
So the picture in the top suggests an 88% CPU load???
I am rarely interested in the average CPU load, I know it wil be low ( < 0.1%) What I am interested in is worst case predictable sub ms timing when multiple interrupts fire at (almos) the same time.
Quite a bit more usefull is to put this PWM into an scope with "infinite" persistance or indeed log it on a LA.
But sure. It does give some indication of average CPU load.
Right. It’s one metric and often not the most helpful. Lots of systems have that instrumentation (and a whole lot more!) built-in too. For example: UIA, if you’re running TI-RTOS.
One nice thing about this approach is that it is low tech, but also it is easy to log if you want to add more debug hardware later. So it is forwards-portable.
Interesting experiment indeed. I would like to see how measured value compares with current draw for the device under test.
It depends… (of course).
If your uC runs madly in a for(;;){} there will be no difference.
If your uC goes to sleep while idle there will be a difference.
If your uC PWM pin is shorted to GND there will be a BIG difference.
I did this once upon a time, but didn’t try to get a numeric measurement: I just hooked up an LED so that it is off when busy. So if the LED ever actually looks off rather than dim, you know there’s a hiccup.
If you can’t afford a USD5 logic anayser which works with sigrok, then a pretty much more usefull way to use this is to trigger a flipflop / led if the measured pulsewidth (single pulse) goes over a certain threshold to indicate an “overload”.
PIC32MM and PIC32MK chips (and many other MCUs) have a DAC that you can use to set multiple analog levels to represent multiple activities (idle, top half ISR, bottom half ISR, updating control loop, etc…) so long as the settling time of the DAC is shorter than the duration of the activity you are monitoring (or as is usually the case you want to know where it is when a reset or glitch occurs) then you can get away with packing a fair amount of diagnostic data into a single pin and a single scope channel.
This is really cute. I do the same thing all the time with an oscope, but makng much of the same information available to just a multimeter makes diagnostics in the field a lot easier. I can think of many worse uses for a GPIO pin.
It does seem counter-intuitive to measure something workload by giving that something… more work to do. Just saying.
Contiki contains the `energest` module to perform a similar thing – software based energy estimation. You can read out the time you’ve spent in wake up, in low power mode, radio on or off, transmitting etc. It works by taking and accumulating timestamps across calls, against a ok-fine-grained timer. Works well enough for the purpose.