
Most of us perceive time as an arrow, a one-way trip into the future. And while that’s true, nature has a way of interpolating circular patterns onto that linear model — day follows night, the seasons progress through the year, and generations are born, live, and die after creating the next generation to do experience the same cycles in the future.
Our star, too, follows this cyclical model, and goes through observable, periodic changes that are of keen interest to solar scientists. So it was with some fanfare that they recently announced that the sun had transitioned into Solar Cycle 25. But what exactly does that mean? Does the Sun’s changing face make much difference to the average person’s daily life? History shows that it can, so it pays to know what we’re in store for over the next couple of decades. Welcome to your primer on Solar Cycle 25.
It Goes to Eleven
For as long as scientists have had the ability to (safely) observe the Sun, they’ve noticed that our star is not the perfect glowing orb it at first appears to be. Galileo was among the first to observe that the Sun was marked by small dark imperfections. Observers began to keep track of these sunspots, noting not only their variable number but the fact that they migrate across the Sun’s surface with time.
It would take almost two and a half centuries for anyone to notice that the periodic nature of the patterns of sunspots. German scientist Samuel Heinrich Schwabe is credited with the discovery of the solar cycle in 1843 after 17 years of observations of the average number of sunspots. Swiss scientists Rudolf Wolf used the observations of Schwabe and others to backtrack through the data back to 1755. For solar science purposes, this was designated the year that Solar Cycle 1 started.
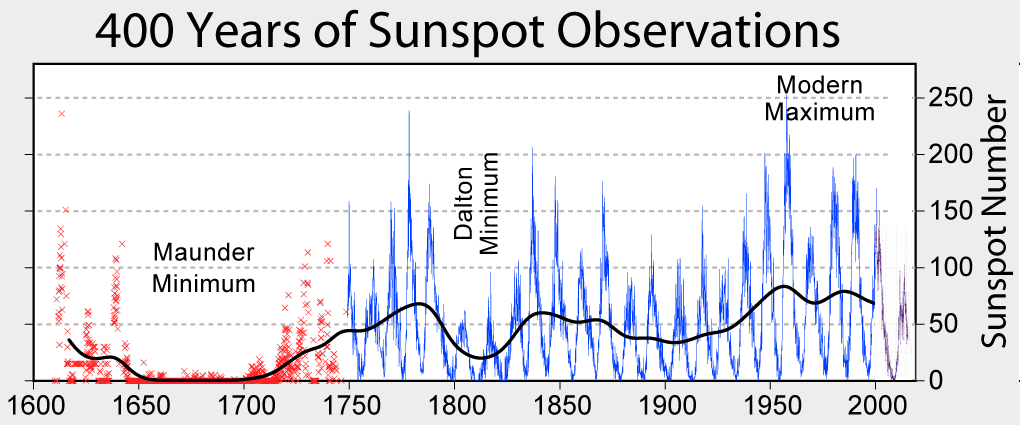
The cycle these pioneering solar scientists had discovered has a remarkably regular eleven-year period. The range of variation is very tight, from the nine-year period of Solar Cycle 2 (1766 to 1775) to almost fourteen years for Solar Cycle 4 (1784 to 1798). Each solar cycle is reckoned from a solar minimum, essentially when the sunspot number reaches its local low. The number of sunspots increases over the first half of the cycle, peaking at the solar maximum point before turning down again to head for the next solar minimum.
The raw number of sunspots is not the only interesting cycle the Sun displays. The distribution of sunspots across the Sun’s surface also changes periodically with the solar cycle. At the beginning of each solar cycle, what few sunspots there are tend to cluster at the Sun’s equator. As the cycle progresses and the Sun becomes more active, the sunspots tend to pop up further away from the equator, generally clustering around the mid-latitudes around 30° north and south. As solar maximum passes, sunspots again migrate back to the equator to start the cycle again.
Flipping Magnetic Poles
The periodic changes in the number and distribution of sunspots may be an interesting observation, but what does it mean here on Earth? To help understand that, it pays to recall that despite their dark appearance, sunspots are only marginally cooler than the surrounding solar material. Sunspots are still extremely energetic areas, and as the number of sunspots increases, the output of the Sun (in terms of luminosity) increases.
Sunspots represent places where concentrated lines of magnetic force emerge from deep within the Sun’s interior. Thus a change in the number and location of sunspots reveals changes in the magnetic field of the Sun. It turns out that what’s behind the solar cycle is these periodic changes in the Sun’s magnetic field. (It’s important to note here that the eleven-year cycle is technically the “sunspot cycle,” and the 22-year pole-flipping cycle is the true “solar cycle,” but it’s common practice to use “Solar Cycle” for both.)
The magnetic poles of the Sun are constantly in motion, with the north and south poles flipping every eleven years. At solar minimum, the magnetic poles are roughly aligned with the Sun’s orbital axis, and magnetic lines of force tend to penetrate the photosphere near the equator. As the poles rotate towards the equator, magnetic activity picks up, magnetic lines of force move to high latitudes, increasing the number of sunspots there. The process continues for the back half of the solar cycle as the poles complete their reversal.
So, as each solar cycle progresses due to the migration of the Sun’s magnetic field, solar output increases. Fractional though these changes are, they have obvious implications for life on Earth. But the increasing brightness of our Sun is far from the only impact felt here. The changing magnetic field of the Sun can also have a huge impact on our planet.
What Happens Next?
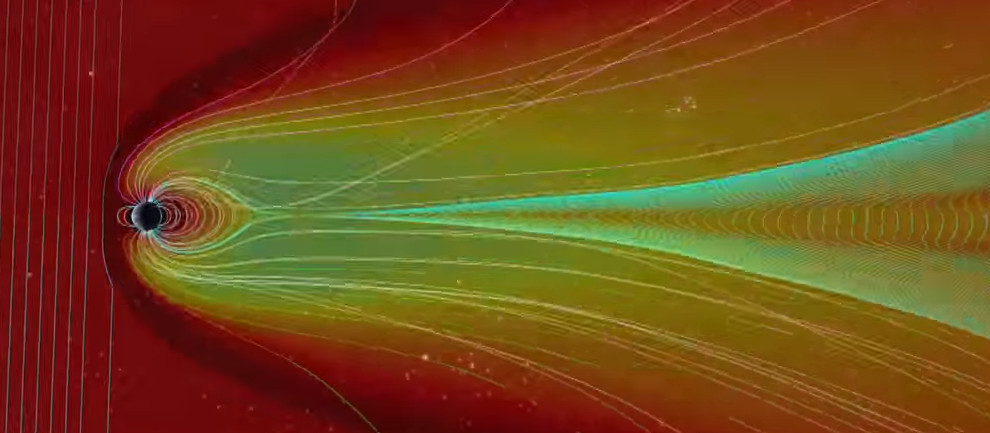
It’s well known that increased sunspots are associated with stronger and more frequent coronal mass ejections, or CMEs. These events, sometimes energetic in the extreme, occur when magnetic domains in the Sun become so twisted and contorted that they erupt outward, picking up gigatons of highly excited plasma from the Sun’s corona. If the CME occurs in just the right spot on the Sun’s surface, the violently ejected tangle of magnetic flux and plasma can strike the Earth, causing anything from an increase in auroral displays to the catastrophic destruction of infrastructure.
 While destructive CMEs are more likely to occur during solar maxima — the 1859 Carrington Event occured near the peak of Solar Cycle 10, and the 1989 Hydro-Québec disaster was about seven months before the peak of Solar Cycle 22 — it’s far from a rule that they only occur then. Plenty of damaging or potentially dangerous CMEs have occurred during solar minima. But the number of CMEs goes up dramatically with the sunspot number, so that the Sun launches a few large outbursts each day during a solar maximum. Simply increasing the number of shots increases the chances of a devasting strike.
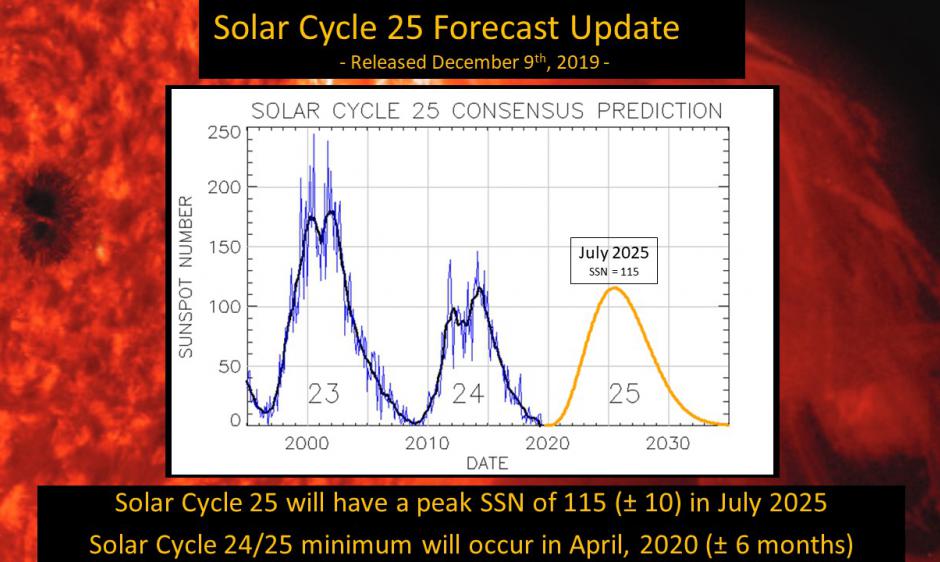
While the increased risk of Earth-striking CMEs during solar maximum is a concern, it’s important to keep in mind a few things. First, solar maximum is still about five years away; NASA says that Solar Cycle 25 officially began in December of 2019, meaning we’re still very much in solar minimum conditions. Second, not all solar cycles are created equal. Layered on top of the eleven-year solar cycle are other periodic cycles that we’re only beginning to understand. One is the Gleissberg Cycle, an 87-ish-year cycle where the solar maxima of the eleven-year cycle tend to increase and decrease. We’re currently in the decreasing phase of the Gleissberg Cycle, meaning that the just-completed Solar Cycle 24 had a much lower solar maximum than the previous cycle. The current prediction is that Solar Cycle 25 will be about the same intensity as the previous cycle at solar maximum, and will reach solar maximum around July of 2025.
The potential for a sleepy sun for the next eleven years is a “good news, bad news” thing. On the plus side, there’s a greatly reduced — but far from zero — risk of experiencing a catastrophic Earth-striking CME. That means less risk to our vulnerable infrastructure, both terrestrial in terms of the millions of miles of power and communications wires we’ve stitched together, and space-based, since satellites can be greatly impacted by space weather. On the other hand, amateur radio operators and others who depend on ionospheric skip for long-range radio communications, like marine operators, airlines, and the military, always get grumpy when the sun is less active, since fewer sunspots mean decreased ionization of Earth’s atmosphere.
In the end, the Sun is going to do what it does, regardless of how it impacts life here on Earth. All we can do is learn everything possible about the star at the center of our solar system, build good models to predict its behavior over time, and build systems that can withstand our star’s mood swings.


Everybody knows that time is a cube.
Except when it is a sphere.
Sure it isn’t a hyper sphere?
It’s a big ball of wibbly-wobbly, timey-wimey… stuff.
😄😄😄😄😄😄👍👍👍👍
Spherical cow?
In a vacuum.
That’s the next time. I think he refers to the first time.
Doc…..Doc….Doc ! English please ! – Marty McFly
You gonna have to accept Internetsh as a language else getting headache after reading comments online. You’re call.
Ouch.
‘Time flies like an arrow. Fruitflies like a banana.’
This is supposed to be “witty”, but as a kid, I always had nightmares about the timeflies…
(Joking.)
Well, you needn’t have worried about the timeflies, unless you were into archery!
(but what kid isn’t?)
B^)
Unless you are accelerating than time becomes plane – this is why you measure it meters per second square.
I thought time was Klein bottle
+1
What’s your gripe?
People first learned about radio propagation by using radio, “hacking”. Any formal studies derived from that.
And while satellites have made “good radio conditions” less important, for hobbyists they are still important. And little sense in building radios if bad radio conditions means you can’t make use of them.
They should have lead with “Hams rejoice – the sun cycle has bottomed out” – that would have made the relevance of the rest to the HaD audience a bit clearer perhaps.
It also would’ve been very confusing, considering:
“On the other hand, amateur radio operators and others who depend on ionospheric skip for long-range radio communications, like marine operators, airlines, and the military, always get grumpy when the sun is less active“
Thx for the refresher. I don’t mind these articles at all popping up once in awhile. Now if America’s Got Talent talking points start popping up or who is who in Hollywood… Then I’d begin to wonder :) . Pure science is all good and as pointed out, radios can be affected by Solar events and weather. Might not be a problem with your ‘hack’ at all but space weather. All good info to ‘know’ about.
HAARP in Alaska used to have a great magnetometer graphic display that illustrated the effect of solar flares dramatically in real time. I used it for estimating prospective Ham communications. It was sketchy, but fun. This stuff is real, and invisible like electronics that captures the imagination of a lot of readers.
Build something, submit an article… You could always demand a full refund of your subscription price…
I enjoy articles like this, the inspire, provoke the imagination. Somebody, maybe a college kid, looking for a special final project idea, might come up with a new way to monitor, track, log, or even predict sunspot activity. Plenty of room on what exactly the sun cycles mean to our planet, how they effect ‘climate change’. They main thing about these articles, is that it’s interesting stuff, that not many people or working at. It could make for a potential career choice for some. There is usually a lot of job competition, before kids graduate. What they went to college for, might be over saturated with candidates, by then.
“You could always demand a full refund of your subscription price”
Contrary to common belief free content is not free. You paid for it or soon will pay. HaD lives from adverts and supplyframe drip-bag. Cost of HaD is counted among many products you buy, from companies that pay for this adverts – chip in your washing machine, phone bill, your next uber ride.
That’s why you have right to demand some high editorial standard.
You owe me 15 seconds for wasting my time reading your whiny comment.
I demand excellent comments.
Odd how the Solar Cycle is not at all accounted for in all the “climate fraud” models used to demand the West change dramatically in order to save the planet.
This is a good science article. It presents hard data without using it to push any socio-political agenda.
The “small percent” variation in total Solar output from peak to minimum of a sunspot cycle adds up to a massive amount of energy. Even at the scale of the fraction of that total output which Earth intercepts, the variation is still a barely comprehensible number.
Every second, Earth catches enough Solar energy to power dozens of Katrina sized hurricanes, and that one hurricane unleashed as much energy in a week as all our power generation could do in 15 to 20 years.
What keeps the planet from boiling is the albedo of the atmosphere and oceans reflects a lot of that energy back to space, and how much of it radiates away at night. If Earth’s rotation was as slow as Venus, this planet would also be a hothouse.
What the human species can do is but a mouse fart compared to the variability of the Sun’s energy Earth catches.
Humans aren’t completely powerless. The extra energy that the Earth retains due to our CO2 is much larger than the variation from the sun spot cycle, for example.
i suggest you fix your mouse fart analogy.
If you think of billions or trillions of mice farting every minute every day, I would say it will become significant.
I am skeptical of human cause climate change.
That said, I am not against protecting our environment from man made emissions or other man made pollutants.
Hi Dan,
Really enjoyed the article.
Had read about the sun cycle before but perspective changes everything.
I went cycling tonight and couldn’t wait to come back to finish reading it.
Thanks
11 year period? And women complain about 5 days!
Many of us enjoy this type of content.
You don’t have to read it if you don’t like it. You also don’t need to comment.
I was not able to find any reference to data or data analysis for the basis of their prediction for the next solar cycle. Anyone have a link?
Do we have any ‘official’ guesses on the accuracy of the mid 19th century data sets for cycles 1 and 2?
And time, as a separate scalar or vector quantity, does not exist. Scalar time is a human affectation. Time does not exist and may not even be an emergent quality of space, if you want to grab on to some of the later quantum stuff. Time may be nothing other than a measure of, or a proportional coefficient of, entropy. Dogs probably have a better concept of time than that of humans (here and now vs discrete and continual arrow).
The way we engineers use time may be bogus, but methinks that instrumented ‘time’ vs space could be a similar analogy to Newtonian vs relativity – so scale of your measured space matters.
https://watchers.news/2019/07/01/valentina-zharkova-on-the-upcoming-grand-solar-minimum/
Somewhere in all of this Pro-Con is the ultimate answer to; “Hack the Planet!” Those who wish a larger challenge may attempt it in the dark. As the SAD (dark) season is upon us, (in the northern hemisphere/cube,) perhaps this will suggest a followup article or device.
I like being reminded of the basics. It helps ground me. And without ground, how could it be said that the albatross was flying?
Well, if the albatross was tied around someone’s neck?
Great article! I’ve always enjoyed observing the financial market correlations related to the sun spot and solar cycles. Granted there are other business or socio-economic cycles to factor in… however, the solar cycle amazed me when I first observed.
Careful here!
Sunspots are such an old (spurious) correlation with economic activity, that “sunspots” is a secret code word among econometricians for spurious correlation in cyclical data.
The short version: when you put something with a cycle up against something else with a cycle, you have to have data from a much longer period than either of the cycles. Imagine two unrelated series, one with a period of 11 years, and one with a period of 12 years. If you start them at the same time, the one “slips” one year against the other every cycle, so you’ve got to have at least half a cycle * the difference * cycle length of data. ((12-11)(11/2)11, say. 55 years, in this made-up example.)
For series with irregular cycles (recessions) this can take a lot longer until the lack of correlation is clear.
Looking for that correlation goes waaaaay back in history:
https://nyaspubs.onlinelibrary.wiley.com/doi/abs/10.1111/j.1749-6632.1961.tb50027.x
This paper made the rounds in the mid-80s, suggesting that economic activity actually caused sunspots, rather than vice-versa. They run the model with lagged variables, and find that economic activity leads the solar cycle in time.
https://www.jstor.org/stable/1058669
It was then debunked by properly specifying the model — sunspots are on a ~11 year cycle and their model only had 4 annual lags. Once you incorporate enough lags, all correlations go away.
Indeed, that’s the solution. Make sure that you’re correctly modelling the periodicity of both series, and then see if your model has any excess predictive power.
Well, at least “everyone” knows the ocean levels are rising because increased obesity is pushing land masses downward!
B^)
I always enjoy reading comments from the both of you. :)
Thanks for the detail! What’s that website where you can bypass the paywalls for research papers?
For economics at least JSTOR is pretty good. If you do their free sign up, you get 100 free articles / month. That’s not too shabby. The preview of the first page seems not to count either.
I don’t know how careful they are about recording IP addresses, storing cookies, etc. It might be possible to get more than one subscription per month if you really needed it.
On sunspots and time-series correlations in general: I think I could have expressed myself more clearly…
The problem is that if you have two series that are trending or periodic, but otherwise unrelated, the trends/periods moving together makes for a high correlation, necessarily, even if the series aren’t logically related. Cumulative rainfall in New Zealand and the S&P 500 tend to be highly correlated, b/c both go up.
But that’s not what you care about. You care about when a deviation from the trend in one influences the other. If a drought in NZ foretold a fall in the S&P, you’d be a millionaire in a month.
So what you need to do is model the periodicity/trend/seasonality of both series, and then see if the deviations from trend move together.
With a series that has a simple trend, you can just subtract one period from the next, and see if the differences (growth rate, whatevers…) are correlated. With longer cycles, you want something like an autoregressive or moving-average model, with enough lags to capture the dynamics. This becomes a first-semester grad-school course pretty quick, but these are the right keywords to go looking around.
The sun spot cycle means that the sun has a greater influence over the earth’s weather and climate than the ignorant stupidity about AGW.
No. The extra heat from the sunspots is very small. Amplitude of the wave is about 0.1% of the total, which is much smaller than extra heat due to CO2 greenhouse effect.
And since the ’80s, the solar maximums have been lower as well, diminishing this already small effect even more.
We have yet to experience the most interesting “cycle” that is the one where the sunspot cycle and Earth’s magnetic field cycle are in phase so that we get a massive CME right when Earth’s magnetic field is flipping. It will fry every single large scale solar array due to the large run lengths of conductors in them. Do the maths on that and the breakdown voltage of silicon junctions and you will see what I mean. Hopefully by then we will just be running on compact aneutronic fusion with the power stations installed deep beneath the surface and power being transmitted via subterranean and fully shielded superconducting cables.
That would be nice, HB11 looks promising, but “Renewables” get renewed when storms hit them. Need to think about jobs. Long term power sources are anti capitalist.
I read time is not really linear; we just perceive it that way.