[k-roy] hates electricity. Especially the kind that can be lethal if you’re not careful. Annoyed by the constant advertisements for the popular Sense Home Energy monitors (which must be installed in the main breaker box by an electrician), [k-roy] set out to find a cheaper and easier way. He wondered how the power company monitored his meter, and guessed correctly that it must be transmitting the information wirelessly. Maybe he could just listen in?
Using a cheap RTL-SDR, it didn’t take long for [k-roy] to tap into this transmission and stumbled across the power readings for his entire neighborhood using a simple command:
~/gocode/bin/rtlamr -msgtype=idm --format=json -msgtype=scm+
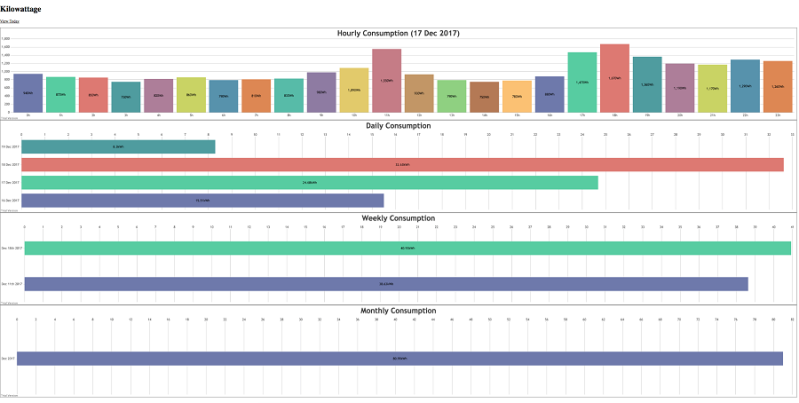
Ironically, the hardest part wasn’t snooping on everyone’s power and water usage patterns in the neighborhood, it was trying to figure out which meter was his. In the end, he was able to make some nice graphical layouts of the data with PHP.
We’ve seen some righteous power meter hacks in our time, but this one stands out for its simplicity and elegance. Be sure to check out [k-roy’s] blog for more details, and [rtlamr’s] github for the program used to read the meters.
Thanks to [Jasper J] for the tip!


“this one stands out for its simplicity and elegance” i.e. running a program designed to do exactly this and that has been around since 2014?
Have you read the article? It is well written and contains a lot more than just the single command. Good stuff!
Yeah, I’d consider that simple and elegant. Using the power company’s existing system with a cheap sdr instead of one of those weird radio guns they point at your meter box from the sidewalk. Certainly makes more sense than splicing another metering system into the wires when one already exists.
Rf from the gas meter to the electric meter. Rf from the electric meter to the wireless monitor then gsm from the electric meter to send their updates.
I had my electric company send me written confirmation the meters could not be hacked and the data could not be intercepted. Not Because I believed them but because I thought it amusing to see what they’d come back with.
There are regions where meters use the wM-Bus protocol (modulation very similar to KNX RF, IIRC) with AES encryption.
it was easy for me to know which one was mine out of about 40 because it broadcasts an ID that is printed on the meter…. what is harder is to find out the physical location of all other meters….
Triangulation by phase delays.
Or go war driving and map signal strength.
Or take the antenna off the receiver so that you can only receive the one closest to you.
Triangulation:
https://en.wikipedia.org/wiki/Triangulation
or Multilateration:
https://en.wikipedia.org/wiki/Multilateration
Hmmm…
so much data just oozing outta peoples homes without a second thought!
So… Some idiot gets the wrong side of a gang and said gang goes around a few times scanning for when most people are asleep and at what time of the week so they can perform the least bait-ly drive-by with minimum to no witnesses.
Maybe a criminal group are targeting buildings that report a high average usage as those are people whom can afford to waste and thus must have loads of nice expensive shiney things (;-D).
Or a terrorist cell finds out the busiest building(s) by average resource-consumption and sends their pawns in for a shoot-n-blast on the likeliest busiest time to ensure maximum carnage.
.
Smart meters are just so dumb to the point it makes Die Hard 4 portrayal of hackers look accurate.
At least that is what this also shows us….
The real question: can I put an RF shield around my meter box and broadcast a spoofed signal to lower my electrical bill? Because without encryption I bet I could.
Meter visibility might put a crimp in that plan.
Whoa…
Interesting.
The power company still probably takes a physical reading once a year.
You would not be able to shield it because they seem to use the connection to the grid as an antenna
My meter is inside a metal box and they can still read it without any problems
Or spoof the signals from the guy you hate to give him a $5000 power bill.
I did it on my SmartMeter with a IR LED
https://github.com/Chrischi-/D0-Logger
Another use for black electrical tape.
So did I, but I’m far more interested in this for my gas meter which doesn’t have an IR LED.
I just checked out that project – supporting documentation could use improvement.
Sadly, the Smart metres that PG&E (the utility which “serves” most of Northern California) uses have Silver Springs Networks radios in them, and appear not to support the protocol. They do have the IR emitter+detector on the front, and with a camera, I’ve determined that the IR emitter blips briefly every couple of seconds or so. A quick mashup of an IR phototransistor driving a darlington to in turn drive another LED allows for easily seeing the pulses. Timing and some math reasonably jives with the instantaneous reading on the LCD (reasonably in that the load wasn’t constant, but the computed value falls in the range observed during the sample).
Tying the IR phototransistor + darlington to an IO on an AVR, configured for pin change interrupt would allow for a very low power overhead pulse counter. The AVR could periodically wake a radio module and broadcast its readings (say even in a format eerily similar to the idm being watched for by the SDR, allowing for the work discussed in the article to be utilized with an otherwise non-RF or proprietary metre).
I was bummed that the metres used by my utility are not compatible.
I was just told that my provider, BG&E, also uses have Silver Springs Networks radios in theirs. I will start looking at their protocol as soon as I get a suitable SDR. Please post here, or elsewhere any results you have. Heck, maybe we can collaborate ;-)
I wonder if you will see this 1 year later…
I just discovered that you can connect to PG&E electric meters with ZigBee.
If you log into your account dashboard, at the bottom it says stream my data. You have to buy a $70 device from rainforestautomation.com, but it has a serial port with an XML api to read all sorts of data from your meter. I just got it today, so I am still exploring.
Well okay, it’s now 6 years after your post, and I finally got around to trying my RTL-SDR with this only to find out that yes I too suffer PG&E not gladly. Any updates on this?
I’d love to know what kind (brand) of meters these are. I work at a power company in the Engineering Department. I believe our smart meters are secure, but I’ve never seen anybody really attempt to hack them. Ours all communicate in the 900 MHZ range, but are supposedly encrypted. Perhaps it is time I get myself and SDR and see what I can see?
Probably about that time. History tells us that companies rarely spend on security until someone painfully beaches it and screws enough if their customers to demand a response. I suppose they think disinterest is the best security.
Word of advice though: sometimes a company shows proper appreciation when you point out a security flaw for them to fix, and sometimes they punish the messenger with termination, lawsuits, and criminal charges.
Some might even say you are hacking and breaking the DRM. And you are gone without fanfare.
i think the idea that there is a security vulnerability in sharing your total power usage is nuts. profiling a building from the outside is already easy…no one is going to go war driving, looking for data centers hidden in homes to steal. an especially posh commercial building will *look like an especially posh commercial building*, you won’t need to look at the electric meter to tell. and if you’re using a ton of electricity to grow pot, the cops already could get at that info. if you’re subject of an investigation, they wouldn’t think twice about sending a guy to look at your meter, or getting the info direct from the power company. if your security needs are really so serious, you’ve got way bigger problems than remote access to your power meter.
wireless electric meters are awesome because the dude doesn’t have to pass through my yard every month
When power usage is lowest or steady for a few hours, it’s likely there’s no one at home, good time to break and enter. That’s not something you would know from looking at the outside of my flat, you can’t see in through the windows from ground level but you can definitely pick up the radio signals from the meter.
Basically, “If you have nothing to hide, you have nothing to fear”.
https://en.wikipedia.org/wiki/Nothing_to_hide_argument
What if somebody had a grudge against your home or business and broadcast a spoofed signal to skyrocket your electric bill out of spite? These transmissions are literally money, they need to be encrypted.
No they don’t. These transmissions can be literally verified with a simple check against a number on a display, and I don’t know of any jurisdiction in the world where the end user is held accountable for being miss-billed where the bill disagrees with the physical meter reading.
In many places meters are often manually controlled as well, and in many more your monthly bill actually isn’t variable but rather an estimate and they only send you a bill once a year with a correction, so it’s not even a lot of effort to verify something once a year.
” Annoyed by the constant advertisements for the popular Sense Home Energy monitors (which must be installed in the main breaker box by an electrician), [k-roy] set out to find a cheaper and easier way. ”
The reason to have such isn’t because it’s cheaper, but it authenticates what the utility meter is saying. It also gives finer granularity of electrical usage. As mentioned in other HaD articles some do have issues about their bills not being an accurate reflection of usage.
Agree. As the saying goes…. “Trust but verify.” A friend installed a toroid type power monitor and discovered his meter was off slightly. A month of monitoring and he was able to prove it. Not wrong by much but wrong. Monitoring the RF would never had revealed the issue.
If you check your power consumption with your own after market $200 meter with clip-on current transformer… you now have two opinions on power consumption. Which is accurate? The cheap clip-on or the utility meter that is supposed to have traceable accuracy? See https://hackaday.com/2017/04/04/how-to-trick-your-electrical-meter-by-saving-power/ for some interesting discussion.
To add to what you’ve said, to measure power you’ll also need the voltage, which, in the UK, is allowed to go up or down 10% from 230 Volts. A current clamp will only measure current.
The only way to trust and verify is to do primary injection testing, not replacing one fallible meter with another likely cheaper one with no legal requirement to calibrate.
What some are doing is placing a traceable analog meter in parallel with the digital. Installed by a licensed electrician no less.
In series not parallel
In case k-roy reads this, you can use the “-unique=true” command line option for rtlamr to suppress duplicate messages from each meter. I’ve been running rtlamr for years; works great for logging my electricity usage.
Any chance of this working on the type of meters used in Canada?
Mine is a Landis-Cyr, FOCUS_AXR-SD. pruduct sheet is here: https://goo.gl/Kwx7Di
thanks
That datasheet isn’t of any help. It says that model is compatible with multiple standards, it would depend on how it is set up I imagine. Easiest way to check, run the program and see what happens.
Not mentioned in the article (that I found after reading it quickly) was the protocols in use by the meters. On my house, the FOCUS meter contains a Trilliant module NCZR101PH with FCC acceptance: TMB-EM000018 which is 2.4 GHz. My understanding is that these are using IEEE 802.15.4 mesh standard with a ZigBee variation. Is there any hope to decode these transmissions?
Basic ZigBee discussion: http://www.electronicdesign.com/what-s-difference-between/what-s-difference-between-ieee-802154-and-zigbee-wireless
will this device force a revolution in RF technology due to easy breach of secrecy and protocol? I look forward to the scenes from the next chapter!
I guess this is OK, if you simply want to know ahead of time, what your electric bill is likely to be, but as the data is only sent on a sporadic basis e.g. every half hour or more, its only useful as a historical record of your usage.
I’m lucky that my local electrical supplier has a free portal where I can access data to the same resolution as this does.
Theoretically the “SmartMeter” that everyone was forced to pay to have installed, has a ZigBee interface for real time power usage monitoring. But in reality, its not easy to get hold of a display unit to show this information, and they cost $$$ and you can’t simply make one yourself, as the protocol is secret and you have to register your ZigBee Mac address with the supplier and they seem to only accept registrations of approved hardware.
Electricity companies are not keen on customers knowing how much power they are consuming, as their bottom line depends on people consuming more electricity not less.
So they are not going to make it easy to get this information, even though its beneficial to the consumer and the planet.
Hey, rtlamr author here.
The command front and center in the article is misleading. rtlamr doesn’t support multiple protocols simultaneously, specifying -msgtype more than once in the same invocation has undefined behavior. I would guess that msgtype will have the value provided in the first flag use.
I should also note that K-roy and I have really bad timing. I few days ago I released a companion utility to rtlamr for collecting and aggregating IDM packets from rtlamr into InfluxDB. To solve essentially the same problem it looks like he put a lot of effort into solving.
rtlamr-collect handles duplicate messages using IntervalCount and TransmitTimeOffset given in each IDM so that only new data is stored.
https://github.com/bemasher/rtlamr-collect
In Southern California, and many other places I’m sure, the power company uses smart meters. With a Rainforest EMU2 handling all the RF reception and protocol handling, you can have continuous, near-instantaneous knowledge of power consumption, bill amount, etc. I used that for about a year, connected to a RPi, it uploaded the data ever 10 seconds and made a few pretty graphs. My recordings matched nearly exactly with visual reading of the power meter and what I was billed for monthly (but who knows how accurate the meter reading is). In the end, it made me aware of how much power devices use, but it didn’t really change behavior… and after awhile, I simply unplugged it and used the RPi for another project.
SmartMeters with SmartAppliances might have made a difference, otherwise it’s micromanagement.
Which meter do you have? What frequency and protocol does it use — perhaps mine is the same and I’ll give this a try.
What meter type do you have? What frequency and protocol is used? I want real-time reconciliation of my solar production vs. grid interaction, and can only get delayed values from SC Edison and Sunpower. I can get what I want directly from the inverter by sniffing packets, but don’t have any information on the meter.
Ah, I see. The Rainforest EMU2 is blessed by the power company. But not too expensive, at least.
Bummer this doesn’t seem to work in California on PG&E meters, anyone have any luck with those?
no, I agree, it doesn’t seem to work here.
Is there an easy way to see if my meter broadcasts by looking at it?
See if it has an FCC ID on the front of it. I would think a non-transmitting meter wouldn’t have an FCC ID. Doesn’t guarantee they they are using SCM, SCM+, IDM, or r900, or some other encrypted method. Easiest way is to just buy the $25 SDR and give it a shot. There’s lots of other cool uses for SDR if it doesn’t work. Getting NOAA and Russian weather Satellite imagery, etc etc etc.
Has anybody come up with a relatively easy way to graph the data generated by RTLAMR? I am successfully logging 24 hour periods using a crontab job that starts at midnight and executes a simple bash script that opens rtlamr with all my settings for a 23h59m55s interval, then at midnight starts again. Currently I’m generating CSV files, importing those manually into excel, getting rid of the data columns I don’t need and then add a column next to consumption that divides by 100 to convert to KWH, then the next column subtracts the newer reading from the older reading to give a KWH consumption for each reading, then manually create a graph daily that plots that usage over a day period. Then each day I add a tab and repeat. At the end of the month all the plots get added together to plot the month. Issue is 1) this is way too time consuming and 2) I haven’t found an easy way for excel to “minimize datapoints” so the charts look really clustered. I wish there was an option in rtlamr to set an interval IF the filterid flat is activated. So… say I only want to take a reading every 15 minutes instead of as the messages come in. Alot of the tutorials I’ve found for doing this are a couple years old, and the tutorials kinda leave the data plotting to your own devices. This is where I’m having difficulty.
The rtlamr is being run on an OrangePi Lite running Armbian and is working great. The folder the logs are stored in is on a samba share so my Windows 10 PC can easily access the log files. The Windows 10 PC (My home media center) has an apache web server with PHP, MySQL server, FTP, etc. So whether the data plotting is done on the Pi or the windows PC is of no difference to me. I’ve never worked with json before, so i’m starting at square 1 there trying to learn it. I’ve never used InfluxDB before but if its anything like MySQL I’m sure I can figure it out.
I’m just hoping to generate a “live” data plot of energy usage, that is “expandable” to look at it on an quarter hour, hour, day, week, month etc etc and work dynamically and with as little input as possible.
If you are successfully doing something like this can anybody help me out? I don’t need a full step by step but atleast what programs are being used and a brief overview of the flow chart from rtlamr output to displaying of the graphs.
Thank you!
This is the best instruction I’ve found, but have never used mqtt before, and am running into issues getting mosquito mqtt to install. The Grafana graphs look absolutely BEAUTIFUL so I’d LOVE to get it working with that… So much reading to do, so little time :(
Oops… URL might have helped…
https://news.ycombinator.com/item?id=13795304
What is currently considered to be the best RTL-SDR device for reading smart meters? Thanks!
I have been using that one: Nooelec NESDR SMArt v4 SDR.
Software for reading meters:
1) https://github.com/weetmuts/wmbusmeters which is using
2) https://github.com/xaelsouth/rtl-wmbus as backend for receiving datagrams
Hi All:
I’m new to this RTL-SDR world. I just purchased the R820T. I have it all installed and configured and it appears to be working in AirSpy. My end goal is to try and read my smart meter as indicated above. I have installed GO, GIT, Visual Studio Code with the GitHub extension. I then installed the RTLAMR and RTLAMR-COLLECT. I saw the commands above that are supposedly supposed to show me smart meters in my area. However, when I run that command in the terminal of Visual Studio Core, it doesn’t work. My question is where should I be running commands such as:
~/gocode/bin/rtlamr -msgtype=idm –format=json -msgtype=scm+
Thanks,
Ray