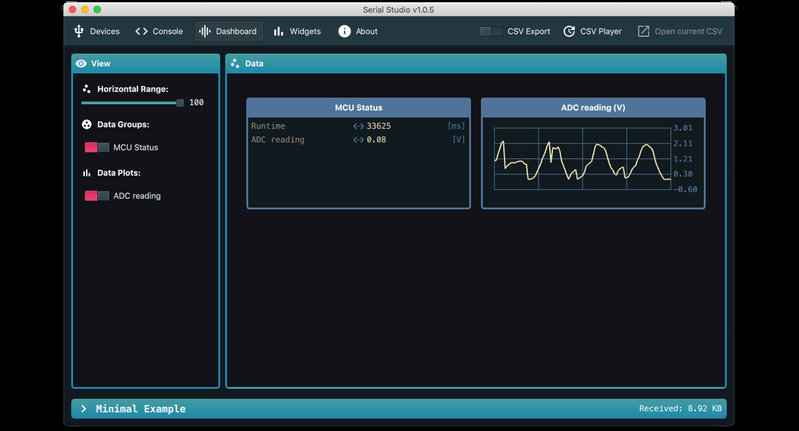
Outputting data from a microcontroller over a serial port is convenient and easy, but formatting, visualizing, and analyzing the data can be tedious and frustrating. [Alex Spataru] knows this all too well, having spent too many hours building and debugging custom dashboards. To save himself and others the same frustration in the future, he created Serial Studio, a tool for quickly building dashboards for serial data.
The only input required for Serial Studio to create a dashboard is a simple JSON structure specifying the data’s format, and how it should be grouped and displayed. Originally Serial Studio required all the JSON data to be sent over serial, which is fine for simple data but quickly becomes cumbersome for more complex applications. To solve this, [Alex] added a feature allowing the JSON document with the format information loaded from the computer, while only the data is sent over serial.
Serial Studio includes several visualization options, including raw line graphs, bar/level indicator, dial indicator, the artificial horizon for IMU data, or a map widget. It can also output the formatted data to a CSV file for further analysis in other software. A console window is also included for viewing raw data or debugging purposes. See the usage demo after the break.
We like Serial Studio’s ease of use and adaptability, and we’ll likely use it for our own projects in the future. It is compatible with Linux, Windows, and Mac thanks to the Qt framework, and the code is open-source and available on GitHub.
If you’ve ever watched one of the BPS.Space model rocket launch videos, you’ll know how critical data logging, visualization and analysis is for [Joe Barnard]’s work. Serial Studio is perfect for such applications, and [Alex] used it extensively for simulated satellite competitions at his university.


Qt5 is not a libre software. If you want to build cross-platform GUIs consider using wxWigets or GTK.
I guess that’s why it is (L)GPL licensed?
Doesn’t wxWidgets require X11?
No. It supports Windows and macOS, and it can also be on top of QT or GTK. http://www.wxwidgets.org/about/
Man you missed the date: this is 1st of February not April…
That was a problem in the early KDE days that resulted in a big controversy and the creation of Gnome. It’s only been 20 years since that was all resolved with QT going LGPL so I understand how that news might not have gotten to everyone yet.
Or Electron with NodeJS.
Please don’t. Electron/Chrome has terrible rendering without high DPI. Well even then, but you notice less there.
Apart of that, Electron has terrible OS integration and doesn’t follow any standards.
Qt is far from perfect, but vastly superior.
terrible font rendering*
Yes it is, for open-source projects.
Looks handy!
Don’t forget, there is a serial data visualiser already built in to the Arduino IDE.
if you can call that crap a “serial data visualizer”
i used to use realterm but its somewhat limited.
i also had an abomination serial grapher of sorts written in lua. its not really a useful tool unless you are the idiot that wrote it, which i was. it started as something for a specific application and accreted completely unrelated features over time.
It’s there, and it has some utility.
Or an IDE…
Embedded development is larger than Arduino.
Below is a link to the free Serial Oscilloscope application by X-IO Technologies (UK) that’s been around since 2013. Serial Oscilloscope is a Windows application. The link takes you to Serial Oscilloscope’s home page which has links to a YouTube demo video and a GitHub repository. I’ve never tried Serial Oscilloscope in Linux, but I bet it will work OK under Wine. I think Serial Oscilloscope is a much better application than the Arduino IDE’s built-in Serial Plotter, but it’s not as simple to use. Quoting from Serial Oscilloscope’s home page:
—-[QUOTE]——–
Printing data to a serial terminal is a useful debugging tool when developing embedded systems but often the data of interest is a continuous stream of numbers that is of little use displayed as text. For example, this might be data from a sensor or real-time statistics such as bandwidth performance. Serial Oscilloscope is a Windows application that plots comma-separated variables within any incoming serial steam as channels on a real-time oscilloscope. The application also functions as a basic serial terminal, received bytes are printed to the terminal and typed characters are transmitted. The project uses Michael Bernstein’s oscilloscope library to plot up to 9 channels on 3 different oscilloscope with view and trigger menus.
Serial Oscilloscope is compatible with any serial stream containing comma-separated values terminated by a new-line character (“\r”). For example,”11,22,33\r” will be interpreted as values 11, 22 and 33 for channels 1, 2 and 3 respectively. The serial stream can also include non numerical characters which will be ignored. For example, “a=0.5,blue,x=3.14,t1t2t3,8\r\n” will be interpreted as values 0.5, 3.14, 123 and 8 for channels 1, 2, 3 and 4 respectively.
The open-source resources also include an Arduino sketch to send analogue input values over serial. In the video I use the Arduino and Serial Oscilloscope to plot data from an IR distance sensor, a triple-axis accelerometer and a microphone.
—-[END QUOTE]—-
* Serial Oscilloscope by X-IO Technologies
https://x-io.co.uk/serial-oscilloscope/
http://www.farrellf.com/TelemetryViewer/
Best i’ve seen so far for serial data visualization.
As there are many other great tools mentioned here: I used KST a lot, which has a “live mode” as well: https://kst-plot.kde.org/
It’s completely free under the GPL and works on Linux, Windows, Mac…
Always looking for this kind of software, thank you!
:o)
To add to the collection:
https://hackaday.io/project/5334-serialplot-realtime-plotting-software
I like the idea of the JSON structure being sent in the serial. That way you could have any number of headless devices collecting data. They just have to be programmed to send the JSON first whenever something attaches before sending data.Then a single viewer “dumb graphical terminal” can plug into any one of them without any prior setup. Just plug it in where you want to know what is happening.
I’m super serial about my data
I’m super serial about my dates.
It doesn’t support binary formar, maybe I’ll add a plugin for data unpacking, stay tuned
Another good one is Cosmos RB from Ball Aerospace: https://cosmosrb.com/
From the write up and project name I thought this would be a tool to snoop on and analyze two-way serial communications, but it appears to be more of a front end builder for a data stream only. Sadly, things linked in the comments appear similar.
For that you need a protocol / logic analyzer rather than those. Check https://www.saleae.com/
and https://www.dreamsourcelab.com/