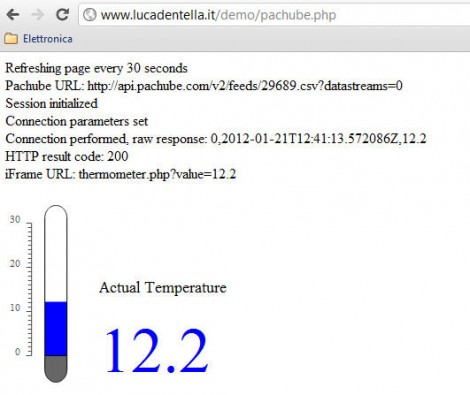
This temperature display may not knock your socks off, but it’s a simple demonstration of how you can used vector graphics as a web readout for data (translated). [Luca] wrote this four page tutorial to help others, he makes it look really easy, and the sky’s the limit on eye candy once you get he basics in place.
The first step is to create the dynamic SVG (vector graphic) file using Inkscape that will be used by the webpage. This starts with a static background, in this case the grey parts of the thermometer which will not change. Over the top the blue parts were added, with just a bit of XML editing to give those parts a hook which will be used in the next step. The demo above will have a moving blue bar and changing numeric output to match data coming in from a temperature sensor.
An SVG file is just a text file that is rendered as a graphic when loaded. [Luca] shows you how to used the identifiers set up when making the graphic to dynamically change the size and value of the blue parts with server-side PHP before sending the graphic to the browser. With that in place you just need to give the PHP file access to the data. He shows how to use the Pachube API but you could just as easily get this via serial or otherwise.


Pretty cool. I did something similar with the WiFly module, I have a php page toss it into a mysql db, then use PChart to graph some thermistor values
http://www.pchart.net/features-charting
not too hard to do, and I didn’t even know php before I started this.
Theres a English version at his website, http://www.lucadentella.it/en/2012/01/22/dashboard-in-svg/ no need to google translate it :)
Great article!
Can’t get to the page: Blocked by mod_slotlimit. More information about this error may be available in the server error log.
hackdotted… try http://www.lucadentella.it.nyud.net/2012/01/22/dashboard-in-svg/
If you hit the above URL in Google Chrome, the browser will offer to translate the page for you.
If someone is interested of sending and receiving data from Arduino using browser, this could help http://code.google.com/p/serwebproxy/ . It’s something i did for my own use, it’s bit hackish, but could be big help. No need for any server stuff, pure javascript is enough (uses websocket). Project needs cleanups and more examples and if people request those, i’m happy to help.
d3.js is very nice.
I did something similar a while back.
Wrote a c# app that would take in some data over serial and use HTTP POST (I think?) to dump it into a database on a webserver.
Then wrote some ajax-y stuff that would refresh the data every 200ms or so without refreshing the whole page. It was a lot of fun! Just all a learning experience – never did anything with it. But web stuff is fun.
Hello!
Thanks to all of you, my ISP called me about a DDOS attack ;) Sorry at the moment its IDS (intrusion detection system) is blocking some connection, please be patience they should resolve the issue soon!
If you have any questions… and yes, my blog is in italian and english language so probably I made a better translation than Google’s one ;)
Can’t see the website unfortunately, but how does he handle browsers that won’t render svg natively like IE?
Could you rasterize the svg at the server with imagemagick maybe?
@nes –
An important point: the author is running a PHP script on a “real” (normal power) webserver. In that scenario, he COULD use imagemagick… it would be an option.
On a very low power server (like one running on an Arduino), image libraries are not really possible. due to lack of processing power. But if your Arduino had the flash space, you could just output the XML and script to do the heavy lifting on the client side.
(Not that I would ever run a webserver on an arduino… it’s smarter to use the limited processing power you have to shove the data over to Pachube, as the author has done).
but you might be stuck with a webserver provider that doesn’t allow you to use imagemagic, such as a free webpage from your Internet provider.
You could just use CSS?
Contain 1 div with blue background inside another with white background and black border.
Change the size of the inner div to match the value you require.
For a “graph” whose interior is square (as in this thermometer), I would agree that CSS is far far less code, and probably more cross-browser friendly.
That said, the if your graph/meter were say a tachometer, voltmeter, or bubbles in a fluid then SVG would be the only way to go (unless you resort to ugly Flash).
Hello!
With IE9, Microsoft added native support to SVG files:
http://msdn.microsoft.com/library/gg589526(v=VS.85).aspx
For older version you can try one of the free plugins available.
As Scott wrote, SVG lets you create gauges, voltmeters and every sort of drawings, charts…
Of course you can “render” SVG files with server-scripting calling ImageMagick or Batik in Java…
Did sometime similar myself a while ago but with HTML5 canvas and some javascript foo for an internet connected weather station.
Weather station > mysql. PHP > mysql > html5 + javascript.
Made animated thermometer viles, gauges and scales.
Worked quite well.
Although I do acknowledge svg files are necessary for more complex but bar graphs, and not that I feel the need to accommodate MSIE, I fail to see why the thermometer bar graph couldn’t be done with pure css. Have an x by y image showing the mercury as blue (gradients work as well) and stretch it by css to a particular height. The numbers in the bar graph can be positioned with css too.
Multiple gradients (stretching from blue via yellow to red) can be combined from several images to display a non-linear gradient using css too. Proof of principle here.
There is a very nice free alternative : HTML5 Javascript charts library
Rgraph : http://www.rgraph.net
Mike