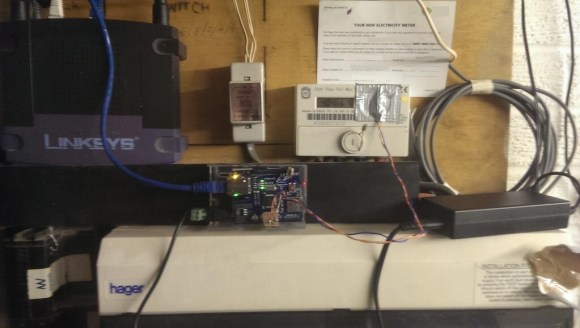
When it comes down to energy management, having real-time data is key. But rarely is up-to-the-minute kilowatt hour information given out freely by a Utility company, which makes it extremely hard to adjust spending habits during the billing cycle. So when we heard about [Jon]’s project to translate light signals radiating out of his meter, we had to check it out.
From the looks of it, his hardware configuration is relatively simple. All it uses is a TSL261 Light-to-Voltage sensor connected to an Arduino with an Ethernet shield attached. The sensor is then taped above the meter’s flashing LED, which flickers whenever a pulse is sent out indicating every time a watt of electricity is used. His configuration is specific to the type of meter that was installed by his Utility, and there is no guarantee that all the meters deployed by that company are the same. But it is a good start towards a better energy monitoring solution.
And the entire process is documented on [Jon]’s website, allowing for more energy-curious people to see what it took to get it all hooked up. In it, he describes how to get started with MQTT, which is a machine-to-machine (M2M)/”Internet of Things” connectivity protocol, to produce a real-time graph, streaming data in from a live feed.
Now, with all this valuable information, other applications can be built on top of it. Interfacing with something like the Pinoccio microcontroller system can allow for devices to be turned off during peak-power times, helping to reduce the billing price at the end of the month.
Energy-intelligence platforms like this assist in conserving electricity while keeping the rate-payer consistently informed of their power usage habits. A real win, win. However, we still need to figure out how to (legally) extract the data from other types of meters.
One example is to harvest the information wirelessly with a special USB dongle to gather the data emitting from the Utility meter. But this only works for that brand of meter. Another solution is to read infrared flashes with an AVR, a resistor, a capacitor, and a phototransistor, which is similar to what [Jon] created above.
So, what kind of meter do you have? And, do you think there is a better way to extract the kWh data? Let us know in the comments, and let’s see what we can come up with.


every time a watt is used? Oh c’mon.
But this is a cool idea indeed.
Nice writeup.
I did something similar but with a Current cost meter and a Pi, http://piamble.wordpress.com/2013/05/13/monitoring-home-elecricity-consumption-with-a-raspberry-pi/ , which gives consumption every 6 seconds. The real value is having a short sampling period. This allows you to determine appliance signatures and understand your baseload and find appliances that are wasting energy. You should not expose the detailed data to the internet – it would allow others to determine if the house is empty of not. The open energy monitor is also worth a look.
Very nice work!
Why a light-to-voltage sensor instead of just a light sensor?
The pulse is emitted probably once every one kilowatt-hour of energy is consumed, not one watt-hour. My mom has a similar power meter and when there’s lots of lights on, TV, computers and the warm water boiler, the light can blink two times a second…
The usual meters seem to have 1000 pulses per kWh.
Some meters i have seen have 2 LEDs with different intervals so you can get an idea of consumption both on low and high loads.
@Entropia: You got that backwards, if your mom consumed two kWh per second, she would require a nuclear power station just for her home. The convention across the majority of meters is 1000 pulses per kWh, so one per Wh.
The system Jon built should be applicable to almost anyone with a not too old power meter, at least I’ve never seen a newer meter that wouldn’t blink. Some of them are slightly different in that they do the opposite – their diode is on all the time and turns off briefly for every pulse.
I stand corrected. I thought it over and it’s like you said. I don’t know what I was thinking. :-)
This is great. I bought into a kickstarter that does this called wattvision, I am using it now and it is great for tracking power. My meter is like the one described it send out a light pulse that shows power usage. Different meters do it differently Wattvision has different sensors.
Keep up the good work.
Damnit, I was just about to write up my solution to exactly the same thing! Only this one is a bit better.
Mine uses an Arduino + Ethernet + LCD Shield and spews UDP packets to my server to log them. This one is a bit better than mine though with the interrupts…
Post it anyways! More is never bad!
I will once I do my version 2.0 one (after taking some suggestions from this article!)
Here’s what my current one looks like:
http://poopr.org/images/sryyloglxcgdb85w7c3r.jpg
http://poopr.org/images/0op4r7ta4dwegx5ntqr.jpg
And all displayed on a tablet in the kitchen (along with data from our solar power unit): http://poopr.org/images/zshr6zt9nc08p5h5vrw.jpg
Nice one – I did a similar thing a couple of years back with a phototransistor and a Raspberry Pi: http://c.cam108.me/?p=11
Never did finish writing up about the software, because I moved to a flat with an analogue dial meter.
Analog dial meters are also hackable in a very similar way: they have a disc that rotates at a speed that’s proportional to the load, and on the edge of this disc is a black mark big enough to sense from a distance using a reflective LED (or laser) + phototransistor combination. I don’t know what quantity of energy each revolution of the disc represents, but that can be easily determined by counting revolutions for a day or so and comparing the count with the change in reading of the analog dials.
My meter has a flashing red led which pulses for every 1Wh.
I read the flashes with another red led connected to an arduino. This setup has been continuously running for a couple of years.
“When it comes down to energy management, having real-time data is key. ”
Why? This seems to be one of those proof by repetition concepts – say it enough times and people will believe it is true.
Now, if you are designing or controlling a factory, that it one thing.
But in a residential setting, exactly why is this useful/valuable?
Using an appliance energy meter one can find out what most appliances use,
leaving just a few directly wired or high voltage appliances (furnace, baseboard heaters, range, dryer) to be estimated.
This allows one to identify wasteful items (major power users, standby wastes, etc.) and prioritize things to be sure to remember to turn off when not in use.
(Much more guess work is required to do that from a continuous overall power monitor).
But more to the point – in a typical residential environment there are few major electrical loads that can easily be shifted in time. Most people work or go to school, so their schedules are highly constrained. They can not shift cooking dinner or doing laundry, or dishes, or taking a shower, to accommodate the electric company.
Turning off water heaters or baseboard heater/furnace when nobody is home is a job for an electric timer, not for an energy monitoring system.
Running the laundry when rates are low will only be practical when they develop a washer that automatically puts the clothes in the dryer or hangs them on the line, and a dryer that takes the clothes out when they are dry. (Or when fashion decrees that moldy, wrinkled clothes are the “in” thing.)
So, what good does overall energy monitoring really do beyond what you could do with a kill-a-watt meter, and an app to nag you to turn off lights/etc. when you aren’t using them.
It’s pretty easy to schedule washing dishes – you just load the dishwasher ahead of time. Though the water heater is even easier to reschedule and makes for the majority of energy used by the dishwasher anyways. (Assuming, of course, that it’s a standard electric water heater.)
Washing clothes doesn’t really use enough energy to be woth much rescheduling. Drying does if you use a dryer (which is, for the most part, unnecessary), but you could just switch off or throttle back the heater in order to reduce usage.
Where energy management really shines is with on site alternative energy. It can let you use thermal mass (e.g. water tanks) for HVAC, refrigeration, and hot water, greatly reducing battery requirements.
I have had a similar project running for years now just using a LDR and the ADC on the Arduino. Currently working on a new design to eliminate the ADC and bring current consumption down to sub mA level so it can run on batteries. All prepaid meters in South Africa has this flashing LED, is this common in other countries too?
I have a Schlumberger Watt-Hour meter on the side of my house here in Connecticut (NU-CL&P). This series of meter has a spinning silver disk in the middle that seems to have several pilot holes in it. When I look down from the top of the glass enclosure I can see my finger moving on the other side. The more power I use the faster it spins. Hence the more pulses per minute I could detect with a photo-diode break beam detector.
Therefore I envisioned this http://oi62.tinypic.com/2v0k51w.jpg
I’m thinking that a break beam electric eye configuration can be built from a LED and a photo-diode in a black straw or something. The pulses could be fed to an Arduino or a PC remotely by a wire back into the house. You could attach it to the left mouse button on a mouse and monitor the keydown event in Javascript.
The rig would be mounted on the rear enclosure with Velcro or double-sided tape and wood dowels or sticks. The LED could be powered by a local 9v battery or a power supply from a exterior AC outlet. The photo-diode could also get it’s power from same leads and pulses could be fed to a long piece of speaker wire into the house. Or the pulses could be self-powered to a solar-cell. All methods would need to be connected via an opto-isolator at the ADC input (or mouse button). This could be done wireless too.
I’d say rather than losing a computer to monitor the mouse clicks, you could just run it into an Arduino and either go Serial -> PC (So you can log it as a background task) or Arduino with an Ethernet Adapter. I’m currently working on version 2 of my power meter using a Spark Core, so it’ll report back to me via Wifi :)
I was just thinking that a wall sign would need to be posted in bold letters for the power company meter reader not to report back to his supervisor that you have some sort of illegal “gadget” hooked up to the meter. The sign would briefly say it’s just a power monitoring idea using a non-invasive electric-eye that in no way interferes with the meter’s operation. You’re only trying to save money by regulating your appliance use inside.
How can you use math to figure out the KWH usage with this click-counting rig? The CL&P power meter is readable via the difference in front dial readings over a specific time period. You have the total click counts over same specific time period. You’ve recorded your timestamps on your front dial readings. You can get the $ per KWH rate off of your most recent electric bill.
Now what is the math?
For your power right now:
lastTime = pulseTime;
pulseTime = micros();
power = (3600000000.0 / (pulseTime – lastTime)) / ppwh;
Where ppwh is pulses per watt hour (in my case, it’s 3.6 pulses per watt hour (3600 per kWh)).
That gives you your usage since the last pulse.
For working out total usage, it’s usage = numberOfPulses/ppwh; to give you total kWh. (That is, number of pulses in a given time frame).
Pretty cool. :D But in NZ I have no need for that as we’re with a company called powershop that has a really cool dashboard to view things like heatmaps (http://tinyurl.com/pjk44dh) of your power usage throughout the month. As well as being able to prepay for credits, of which they sell in packs and sometimes have specials where you can get bonus credits etc etc.
Only updated per hour, but that’s good enough for a home, I think.
Hi all,
First time I’ve checked back here, didn’t realise there were so many comments. I’m the Jon who put this project together. Thank you all so much for your comments, really good feedback and i’m humbled.
The project was more of a “see if i can get anything out of that flash” and was a product of googling and bastardising arduino code to have what is now a functioning product. The unit has been in place around 2 years now and I literally forget its there. The data is all logged into a database and displayed through a web interface rather than using Xively. I always try to do everything at home so an internet connection is not required, this way an outage will not skew results.
The next step in this project is to read the gas meter, I haven’t got around to starting that but it will be along the lines of the commenter who suggested monitoring analog spinning disk meters. I’ll be using the last number dial on the meter which has a solid silver circle for the zero number, I can use an infrared “optoswitch” which is essentially an infrared led and photodiode which will recognise the reflection on the silver disk.
From there the code will pretty much be the same on the arduino.