When you’re trying to learn how an algorithm works, it’s not always easy to visualize what’s going on. Well, except for maybe binary sort, thanks to the phone book. Professor [thatguyer] is a computer science teacher who wanted a way to help his students visualize the process of algorithms and at the same time, get a grasp on their resource cost.
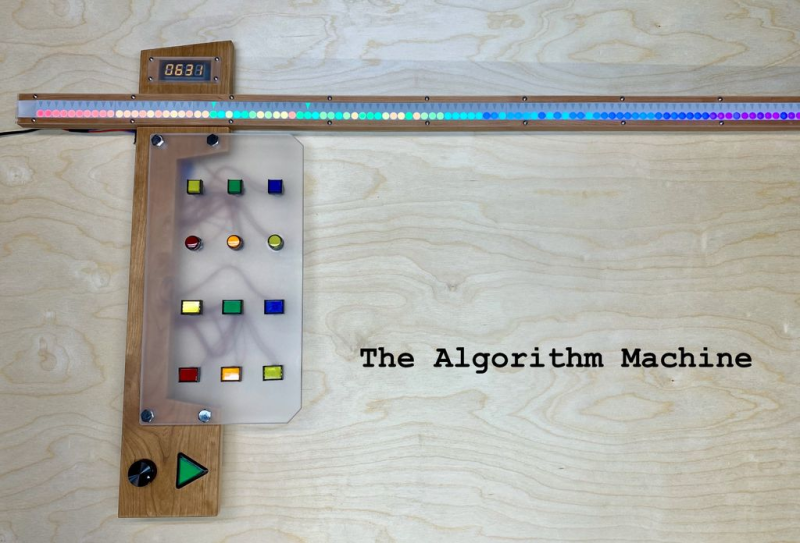
 The Algorithm Machine can demonstrate 8 different search and sort algorithms using two 100-count strips of RGB LEDs — one to represent an array of integers, and one to create indicators pointing to the integers under scrutiny.
This functional beauty is totally interactive, too. Once the user chooses the values and the algorithm and starts the process, they can speed it up or slow it down with the rotary encoder, or pause to discuss and start again with that slick triangular play button. We particularly like the control button wiring harness [thatguyer] created to keep everything neat and hot-swappable.
This iteration uses 3D printed face plates to give the LEDs shape, but in an early version, [thatguyer] cut and sanded a ton of circles out of brass tubing, and folded as many triangles cut from disposable baking pans. The world could use more teachers as committed as [thatguyer]. This really seems like a handy teaching aid for these concepts, and we wish we’d had one in class to play around with. Here’s your algorithm for watching the demo: click break, press play, enjoy.
If you’re still confused, there are other ways to understand algorithms through visualization. Failing all that, just watch these Hungarian folk dancers work out various algo-rhythms.


Back in my day we just had visualisation material like “Bubblesort” on side B of the ZX Spectrum “Horizons” demo tape…
Skip to 13:10 https://www.youtube.com/watch?v=LMzc27HDt8c
Online visualizations
https://www.toptal.com/developers/sorting-algorithms
Nice.
I’ve always enjoyed this visualization, with sound: https://www.youtube.com/watch?v=kPRA0W1kECg
And I always like sharing the Hungarian line sorting dances: https://www.youtube.com/watch?v=lyZQPjUT5B4 (Bubble sort, there are others by the same group)
I’m surprise no one has suggested the classic movie “Sorting out Sorting”: https://www.youtube.com/watch?v=HnQMDkUFzh4
“it’s not always easy to visualize what’s going on. Well, except for maybe binary sort”
I can’t seem to recall binary sort. Could it be binary search?
Split list in half, recursively sort each half, now merge the two sorted lists. AKA Merge sort.
Seeing the reference to the phone book, the author most likely meant binary search.
Am I the only one who was disappointed this didn’t involve Skittles after reading the title?
The article says “click break”. My keyboard doesn’t have that key.
As someone born without visual memory or imagination (no mental pictures at all…) I have always struggled with the concept of visualization. I diagram algorithms and data structures and mechanical things (like most people but perhaps moreso) but for me the key is that the diagrams are a middle step; I use them to translate things stated with a visual metaphor into a conceptual understanding that doesn’t rely on any visual reasoning as only then do I usefully understand. (otherwise, I may be able to reason about it with scrap paper but take the paper away and I’ve lost my understanding).
As such, sometimes a visual step like this is a big help, but sometimes it is counterproductive in that it enforces a visual metaphor in favor of a conceptual one. I remember when I was a kid and first got that the head and tail counters in an array being used as a FIFO behaved much like any other modular arithmetic system and it was no longer necessary to try (and fail) to visualize them.
Finding conceptual models that do not rely on visual reasoning for some things (like graph theoretical algorithms) is very hard. For other things (simulated annealing and genetic algorithms for example) are much easier to handle conceptually even for visual thinkers when you start talking about spaces with 11+ orthogonal dimensions. For that reason it’s not just freaks like me who need these non-visual models!
I have a similar issue with colors; not color blind but my imagination is. But I guess if it helps 90 percent understand what’s written in the text book a little better and the rest of us can still learn the way everyone would have to if not for the visual tool then it’s still worth it.