In proper, high-dollar embedded development environments – and quite a few free and open source ones, as well – you get really cool features like debugging, emulation, and profiling. The Arduino IDE doesn’t feature any of these bells a whistles, so figuring out how much time is spent in one section of code is nigh impossible. [William] came up with a clever solution to this problem, and while it doesn’t tell you exactly how much time is spent on a specific line of code, it’s still a good enough tool to be a great help in optimization.
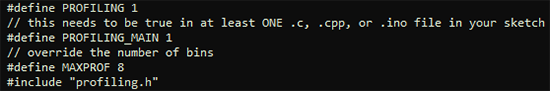
[William]’s solution is to create a ‘bin’ for arbitrary chunks of code – one for each subroutine or deeply nested loop. When the profiler run, you end up with a histogram of how much time is spent per block of code. This is done with an interrupt that runs at about 1 kHz, with macros sprinkled around the code. Each time the interrupt ticks, the macro runs and increases a counter by one. Let the sketch run for a minute or so, and you get an idea of how much time is spent in a specific area of code.
It’s a bit of a kludge, but when you’re dealing with extremely minimal tools, any sort of help in debugging is sorely needed and greatly appreciated.


I still prefer to toggle some digital pins before/after critical code and check runtime on the oscilloscope. Of course an Oscilloscope is some luxury when working with Arduino….
I popped in here to voice this as my method as well
This is basically statistical profiling. With a little more knowledge of the constructed binary, you can even do it without the macros, just by storing or reporting the position of the program counter.
Wouldn’t knowledge of algorithm analysis and design be a more minimalist tool? All you need is your brain!
Algo design can only get you so far unless you have perfect and complete understanding of the platform. For example, I’ve seen hobbyist game developers get wrapped around the axle trying to minimize draw calls when what’s really killing them is texture switching.
Why would texture switching be anything more than simply updating a pointer before redraw and why would there ever be more than one draw call? I’m guessing to update specific parts of the screen, but wouldn’t a good wrapper handle such requests so that it all goes into the same draw? Also, no flicker!
Usually no.
When analyzing algorithms, you usually care about the complexity class. This is more of a magnitude of order estimation as it is concerned with asymptotic behaviour. This is rather far from the really of microcontrollers who are much more sensitive to the things you let fall under the table in common algorithm analysis.
When you really wanna know how your code performs it’s also not enough to just look at what you wrote. It’s much easier in the embedded world than for x86, but the actual instructions the compiler spews out can be vastly different from what you get by naively translating your C code into assembly. (Don’t ask about C++!)
Read up on compile time optimizations and you’ll see there’s a lot that can happen.
And even then, if you branch on things not known at compile time (e.g. different behaviour depending on some input pin) you can’t really know what will happen. You’ll have to make assumptions. And assumptions tend to be wrong, even more so when being wrong would be a problem.
So in the end, there’s two sane options that get you reliable results:
1. Just measure on the real hardware. That’ll give you the definite answer (in most cases).
2. Simulate the hardware.
Arduino has a built in timer called “micros()” it return the time since the arduino has started (untill it overflows). I usually just make a variable “time_code_begin” and a “time_code_end”. I’ve never used a scope for this, purpose, but it does sound like a good idea, but it is kind of a hassle.
If you want to know how much time is spent in a particular function, all you have to do is read microseconds before the function, and after the function, and keep a running average of this value. You can even calculate to submicrosecond accuracy because if it reads 0 microseconds one loop, and 1 the next, then even though both times it might have taken only 0.5 microseconds and the clock simply didn’t tick over by averaging the values you know the true time it took.
does arduino gcc (whatever that is) support -finstrument-functions ?
then overide
void __cyg_profile_func_enter(void *func, void *callsite);
void __cyg_profile_func_exit(void *func, void *callsite);
typically with this poor mans profiling, you get the compiler to generate a prolog/epilog that gets called before and after each function, that function then can time the call, since its before and after.
With compilers that don’t have epilog/prolog generation you can just add a macro say __PROLOG __EPILOG that use __FILE__ __LINE__ and some compilers have __FUNC__ or add the name of the function in the macro. Its a really useful thing to do get into the habit of because not only can you use it for profiling speed, but for memory usage, and memory overwrites or other coding problems that can be difficult to track down on embedded systems.
the obvious problems with this types of profilers is that you’re changing the compilers behaviour with the volatile and forced no inlines, as well as added code, sometimes the compiler will just decide a function is too complex or scores low and it won’t generate optimum code, on most arduino stuff it doesn’t matter, but you can soon find yourself calling a library function for something the compiler may be able to optimise away, or use intrinsics.. but its a poor mans pofiler,