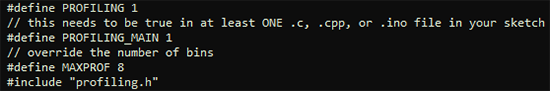
There was a time when you pretty much had to be an assembly language programmer to work with embedded systems. Yes, there have always been high-level languages available, but it took improvements in tools and processors for that to make sense for anything but the simplest projects. Today, though, high-quality compilers are readily available for a lot of languages and even an inexpensive CPU is likely to outperform even desktop computers that many of us have used.
So assembly language is dead, right? Not exactly. There are several reasons people still want to use assembly. First, sometimes you need to get every clock cycle of performance out of a chip. It can be the case that a smart compiler will often produce better code than a person will write off the cuff. However, a smart person who is looking at performance can usually find a way to beat a compiler’s generated code. Besides, people can make value trades of speed versus space, for example, or pick entirely different algorithms. All a compiler can do is convert your code over as cleverly as possible.
Besides that, some people just like to program in assembly. Morse code, bows and arrows, and steam engines are all archaic, but there are still people who enjoy mastering them anyway. If you fall into that category, you might just want to write everything in assembly (and that’s fine). Most people, though, would prefer to work with something at a higher level and then slip into assembly just for that critical pieces. For example, a program might spend 5% of its time reading data, 5% of its time writing data, and 90% of the time crunching data. You probably don’t need to recreate the reading and writing parts. They won’t go to zero, after all, and so even if you could cut them in half (and you probably can’t) you get a 2.5% boost for each one. That 90% section is the big target.
The Profiler
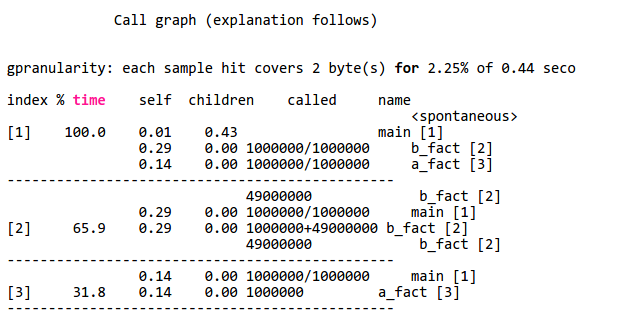
Sometimes it is obvious what’s taking time in your programs. When it isn’t, you can actually turn on profiling. If you are running GCC under Linux, for example, you can use the -pg option to have GCC add profiling instrumentation to your code automatically. When you compile the code with -pg, it doesn’t appear to do anything different. You run your program as usual. However, the program will now silently write a file named gmon.out during execution. This file contains execution statistics you can display using gprof (see partial output below). The function b_fact takes up 65.9% of CPU time.
If you don’t have a profiling option for your environment, you might have to resort to toggling I/O pins or writing to a serial port to get an idea of how long your code spends doing different functions. However you do it, though, it is important to figure it out so you don’t waste time optimizing code that doesn’t really affect overall performance (this is good advice, by the way, for any kind of optimization).
Assembly
If you start with a C or C++ program, one thing you can do is ask the compiler to output assembly language for you. With GCC, use a file name like test.s with the -o option and then use -S to force assembly language output. The output isn’t great, but it is readable. You can also use the -ahl option to get assembly code mixed with source code in comments, which is useful.
You can use this trick with most, if not all, versions of GCC. Of course, the output will be a lot different, depending. A 32-bit Linux compiler, a 64-bit Linux compiler, a Raspberry Pi compiler, and an Arduino compiler are all going to have very different output. Also, you can’t always figure out how the compiler mangles your code, so that is another problem.
If you find a function or section of code you want to rewrite, you can still use GCC and just stick the assembly language inline. Exactly how that works depends on what platform you use, but in general, GCC will send a string inside asm() or __asm__() to the system assembler. There are rules about how to interact with the rest of the C program, too. Here’s a simple example from the a GCC HOWTO document (from a PC program):
__asm__ ("movl %eax, %ebx\n\t"
"movl $56, %esi\n\t"
"movl %ecx, $label(%edx,%ebx,$4)\n\t"
"movb %ah, (%ebx)");
You can also use extended assembly that lets you use placeholders for parts of the C code. You can read more about that in the HOWTO document. If you prefer Arduino, there’s a document for that, too. If you are on ARM (like a Raspberry Pi) you might prefer to start with this document.
So?
You may never need to mix assembly language with C code. But if you do, it is good to know it is possible and maybe not even too difficult. You do need to find what parts of your program can benefit from the effort. Even if you aren’t using GCC, there is probably a way to mix assembly and your language, you just have to learn how. You also have to learn the particulars of your platform.
On the other hand, what if you want to write an entire program in assembly? That’s even more platform-specific, but we’ll look at that next time.