Ever obsessed with stripping the hype from the reality of power tool marketing, and doing so on the cheap, [a
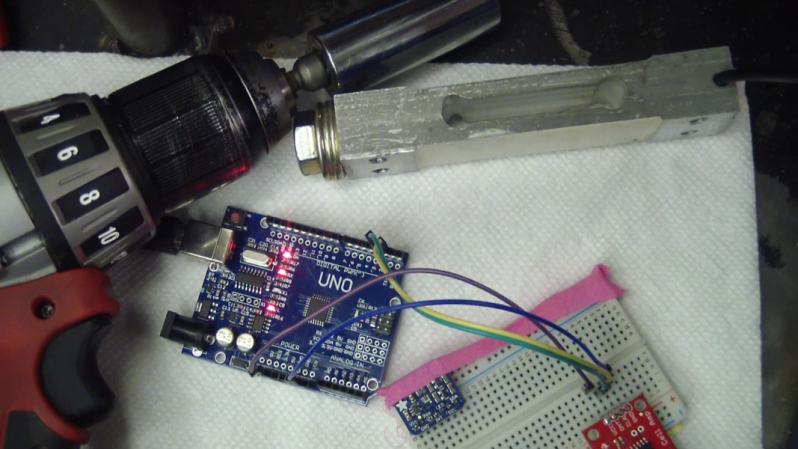
For those of us used to [AvE]’s YouTube persona, his Instructables post can be a little confusing. No blue smoke is released, nothing is skookum or chowdered, and the weaknesses of specific brands of tools are not hilariously enumerated. For that treatment of this project, you’ll want to see the video after the break. Either way you choose, he shows us how a $6 load cell and a $10 amplifier can be used to accurately measure the torque of your favorite power driver with an Arduino. We’ve seen a few projects based on load cells, like this posture-correcting system, but most of them use the load cell to measure linear forces. [AvE]’s insight that a load cell doesn’t care whether it’s stretched or twisted is the key to making a torque meter that mere mortals can afford.
Looks like low-end load cells might not be up to measuring the output on your high-power pneumatic tools, at least not repeatedly, but they ought to hold up to most electric drivers just fine. And spoiler alert: the Milwaukee driver that [AvE] tested actually lived up to the marketing.


Those load cells are not made for this application of force. They are designed to be used in kitchen scales and so on, as they measure a shearing force perpendicular to their surface.
This application that wants to measure the torsional moment of the load cell might work as it deformes the strain gauges (which are connected in a wheatstone bridge and in normal application of force two are compressed and to are stretched) but there is no guarantee that the output signal is linear or reproducible to the applied torsional force.
What might work better: Drive a camshaft with the electric drill and let the cam push on the load cell in its rated direction of force.
When I saw him post this this was my exact thought.
Torque is a moment measurement. Use a known distance lever, then calibrate and it should be just fine. The advantage is the load cell works in the same range it normally does and you are applying torque more linearly in the expected ranges. By applying torsional loads to these cells, who knows what the resistor elements are experiencing, especially since at certain limits he is able to plasticity deform the metal, completely de-calibrating it.
Here’s the basic wheatstone bridge:
https://upload.wikimedia.org/wikipedia/commons/thumb/9/93/Wheatstonebridge.svg/300px-Wheatstonebridge.svg.png
In this picture they’re trying to find the value of RX by changing R2 until the voltage between the two branches is zero, whereas in a load cell the value of RX is already known and we’re trying to measure R2 by observing the difference in voltage.
In the load cell case, R2 is the strain gauge strip in the load cell which gets stretched out, but what is commonly left unmentioned is that R1 is actually a second identical strain gauge strip that is glued in perpendicular to R2 so that it does not change in value when you load the cell the usual way. This is because it’s important that both R1 and R2 have the same temperature coefficient to cancel out any effects of temperature. If the temperature changes, both R1 and R2 change the same amount. The same applies to R3 and RX – they’re identical, so the output of the voltage divider remains independent of temperature. It’s also handy because both branches have 1:1 ratio in the neutral state, so the neutral output voltage is zero.
When you twist the cell, it changes the values of both R1 and R2 instead of just R1 and the Arduino “sketch” you use to measure the cell becomes inaccurate because it assumes that only R2 changes. You can calibrate it to some value of torque, but the reading will be wrong for anything outside of that value.
It’s still somewhat usable, but you have to build a table of values for the correct offset outside of your calibration point.
http://www2.humboldt.edu/scimus/HSC.36-53/Descriptions/Wheatstonebridge.jpg
Seriously. Idiots: stop using PNG – you’re always doing it wrong. It’s the worst picture format invented because everyone’s always trying to be too clever with it.
if PNG is wrong, I don’t want to be right. making a transparent png isn’t the wrong way to do it; you just borrowed the wrong image
Viewing the original image in the browser shows it with a white background because the browser renders it that way. It only reveals itself to be transparent when you drop it on a page with a dark background.
The reason why PNG is horrible is because it tries to cover too many different use cases, and when you give such a format to stupid people, the stupid people will use the wrong features on the wrong use cases because they can.
For example, using the alpha channel on a black line diagram to make the background transparent despite knowing that it must and will be displayed on a white background anyways. Other variants of PNG stupidity are 32 bit instead of 8 bit even when the picture is a simple line diagram, and using PNG as a generic format for posting everything from game screenshots to holiday photos “because it’s lossless and therefore it’s better”.
The main problem is that ordinary users have absolutely no idea what is well compressible with PNG, so even when you say “don’t use 32 bit PNG on complex graphics”, they still use it on complex graphics and blow up the file size with no discernible difference in output quality. Then they bitch about why their websites and emails load slowly, and their documents and presentations take up hundreds of megabytes.
Saying “PNG works well with simple diagrams and charts” in practice means that you should save a fancy 3D rendered pie chart with a photo of your product on the background as a 32 bit PNG.
End of rant.
So we should eliminate all formats instead of educating users or fixing display issues in browsers that make assumptions?
The only thing truly idiotic is the idea that we should abandon something because someone doesn’t know how to use it.
“So we should eliminate all formats instead of educating users or fixing display issues in browsers that make assumptions? ”
Actually, Firefox used to render the background color black when viewing a plain image, but because there are so many transparent PNGs out there, they had to change it to white because people complained that the browser renders them wrong.
“Educating users” is a nice idea, but ultimately naive. Who’s gonna do it? You?
Instead, don’t make formats that try to be everything for everyone.
+1
Then go ahead and use JPEGs for everything, but don’t blame me when others complain about the artifacting that is especially easy to see on text and drawings.
99.9% of the people don’t, and are often surprised when they just can’t find the artifacts that “should be there” because some zealot told them JPEG has horrible artifacts. But that’s hardly the point. Of course you wouldn’t use JPEG to encode a picture of a page full of text – but why would make a picture of just plain text anyways? It’s usual that you have text AND image, and the image in question usually forces the use of lossy encoding.
Yes, you can use PNG – it’s just that as a regular every day user, whenever you feel the need to use PNG for a file you intend to post online, it is almost assured to be a case where you shouldn’t use PNG, and even when you should, you shouldn’t, because you don’t know how to fucking use it.
Let me present you with a real-world use case where PNG would be technically correct, but where JPEG should practically be used.
A user recieves a fax or a letter/form, scans the page and sends the file over email. Now, we know that faxes and forms are mostly 1 bit B&W images, so we could just crank the contrast up and use a limited palette PNG to encode the whole page in very high resolution into a comfortably small file.
This is NOT what happens in reality: the user takes a 32 bit full color scan of the page with a resolution where even the fibers of the paper can be seen, then, and because some zealot told them that PNG is great for things like faxes they save the whole thing as a 90 Megabyte PNG and email that to you.
It is possible that the second temperature compesating strip is located away from the first one so that it doesn’t get stretched significantly when the cell is being twisted, in which case the readings may be close to accurate.
In any case, without knowing the internal structure of the device, it’s impossible to assume that it will work. You just have to load it with different amounts of torque while trying not to load the cell the normal way at the same time – which is kinda difficult – and see what it says.
But the author of the video is still over-thinking it. He didn’t need to twist the load cell. He could have just put the bolt sideways through the end of the load cell, clamp the other end in the vice, and try to spin it. How much force in pounds the cell reports multiplied by the length of the lever between the center of the bolt and the vice, in feet, is torque in foot-pounds.
Also, twisting the load cell causes shear deformation in the strain gauge strip, which causes a non-linear change in resistance to the amount of torque being applied. The larger the twist angle, the more the resistance increases per unit torque.
So again, the readings are most likely just total garbage.
Also, there’s a very simple way to measure torque with a kitchen or bathroom scale, without Arduinos or anything. Take some sort of L-bracket and screw it onto the tabletop, put a bolt through it, and put a 1 meter lever on the bolt. Then place the free end of the lever on a kitchen scale and start turning the bolt with your drill. Remember to zero the scale before you start.
How many kilograms the scale reads is equivalent to kgf-meters of torque, which is very close to being 10 Nm per kilo. That was close enough for the Soviets to shoot Sputnik and Laika into orbit, so it’s good enough for our purposes.
Here’s a version of the device made with a fishing scale and an adjustable brake so you can measure the torque of a spinning motor instead of just the stall torque.
http://www.instructables.com/id/Bench-top-dynomometer/
Dax, whats your thoughts on this :p
It is called a pony brake, just in case anyone wants to delve straight into their research.
You are MOSTLY right.
Actually, the complement resistor to Rx is R3. And they don’t HAVE to be at the same temp. In fact, R1 and 3 are typically back at the sampling unit, while R2 and Rx are on the load cell (so you got their placement right).
Often the critical concern is less about temp difference and more lead resistance. So the wires to Rx and R2 are doubled up and the second wire set used to compensate for the long line resistance.
OK so why two gauges(R2 and Rx)? Look at VG. It measures the DIFFERENCE between D and B.
R2 and Rx are usually mounted on opposite sides of the bar stock on a WEIGHT cell. When the bar bends, the outer side of the bend stretches while the inner side compresses. Buy in reality we want the bar to appear solid. IE it still must hold the weight applied to it. So the bar bends in an imperceptible amount for the human eye (or even most high resolution cameras). Having just one gauge would give you a very small change. Two cells, one bending one stretching (or in electrical terms, one resistance increases, while the other decreases, but by EXACTLY the same amount) means we always double the value measured. It is like having a hardware gain of 2x.
Now.. I made a clear indication that there is more than one thing you can measure. Weight being one. But in truth strain gauges measure strain… Any form of distress on the surface of a material. So we can measure bending, stretching, and compression. To measure weight or a linear bend, both gauges are aligned the same direction on opposite sides. As one bridge.
To measure surface flex in two dimensions we put two gauges on one side, 90 degrees out of phase (IE aligned with X and Y). Independent bridges, since we measure TWO parameters. In this case, R2 is off site (back at the ADC) and temperature becomes an issue. Also you have to double your value since you do not have that paired gauge.
However, clever mechanical engineers often want to find the strain difference between two physical sites, and will mount the R2 gauge somewhere else on the material.
To measure surface flex AND compression/stretching, we add a third gauge at 45 degrees.
To measure twisting/torsion, which is needed here, two gauges on opposite sites AT 90 degrees out phase. And some fancy math is now involved. We are now really measuring a vector of change. I have no idea how to do that math. I only mounted the gauges ;)
The load cells I have, have two wires going in, and two out. The full Wheatstone bridge is built into the device.
There are multiple ways to build one, and multiple ways to measure one. The cell in the video is the kind with the full bridge underneath that epoxy glob, where all the strain gauges are on the same side of the bar, and on the same side of the “H” circuit (R1/R2) and you are measuring the changes in only one while the other compensates for temperature. It is simpler to construct, and easier to assemble, which makes it cheaper.
In this case the complement to R2 is not Rx because the voltage you’re measuring is the proportion of R2 to R1. R3 and Rx are there just for producing a reference voltage that is relative to the source voltage. You could technically move R3/Rx out of the cell entirely or have some other voltage reference, but as you point out then you’d have to account for line resistance.
We could have a similiar load cell with the two strain gauges on the opposite sides, so that R1 would compress while R2 stretches, and that would work fine as well, but the signal would behave differently. Hence, when writing a program for these load cells, you have to mind which kind you have.
Assume a steady source voltage of 1 Volts. The output from the R1-R2 branch is R2 / (R1 + R2). If both are identical strain gauges, the output is 0.5 at the center.
This is being compared to the fixed division Rx / (R3 + Rx). The latter could be anything because it’s just an offset. You could be measuring the voltage against your source ground just as well, but the point of the other pair of resistors is that the divided voltage changes with the source voltage so your zero point doesn’t drift. If R3-Rx are identical, then their output is again 0.5 and your cell gives out a 0 volt difference at center regardless of what the input voltage is.
When R2 and R1 both change in equal and opposite manner, the output is linearily dependent on R2 with a fixed scaling factor that depends on the input voltage. That is, if R2 is linearily dependent on strain, the output is linearily dependent on strain.
If we used R2-Rx as the strain gauge pair and identical resistors (R1 = R3) for the upper legs, the output would be the difference: R2 / (R1 + R2) – Rx / (R1 + Rx). Suppose R1 = 1 and the output simplifies to R2 – Rx / (Rx*R2 + 2) which is non-linear and quite difficult to deal with. That’s why this configuration is not commonly used.
When only R2 changes, the output becomes relative to R2 / (R1 + R2) which too is non-linear, but the error is small when we’re measuring very small strains.
Sorry. I mixed up a little.
If we used R2-R3 as the complementary pair, the output would become a difficult mess nonetheless, because you’d be subtracting one non-linear function from another and I can’t be arsed to solve what the result would be.
Is HaD a delayed copy of the YouTube feeds now a days?
Also:
Ave says to do the job properly you need an expensive piece of kit, so here’s an Arduino to do the job poorly. Then he talks funny to get thumbs up even though the thing he did was clearly very wrong.
Yes, it is. How much delay there is differs. Sometimes it’s hours, sometimes a few days (like in this case) and other times it can be a year or two. Now, where’s your threshold? Is an hour ok for you, or do you need it the second it hits youtube? What would be satisfactory to you dear sir?
I’m surprised you didn’t mention Reddit or something as well… You’re that guy that unironically yells “Simpsons did it!”.
He’s not talking all that strangely for a Quebecois. He’s hamming it up a bit, but not much. The further north you go, the odder they get. Much of my extended family talks a bit like that – It’s just the way they go. Cultural, I guess.
How wrong is it to create a non-linear measurement system, calibrate it to a known quantity and check to see if something hits that calibration value? What he did actually worked for the immediate area around which he was measuring, he just didn’t explain that in any detail.
Also no HaD is not a delayed copy of YouTube feeds now a days. It has ALWAYS been. That’s kind of the idea about an aggregation site.
In the past I’ve used 3-axis load cells to resolve torques and loading on mechanical systems. Hard part is getting the error down in a dynamic system. Static loads worked fine.
I might add that your load cell must be rated at a much much larger stiffness than what you are measuring….
The double beam load cell is designed to measure force , not torque ;In this case it is absolutly non linear and sensibility is very low . One solution woud be to use 2 force load cell or better a torque load cell : basically a pipe with strain gage at 45 °
A torsional load cell is easily made. Install strain gauges on a piece of round stock and measure as you would any Whetstone bridge. If I remember correctly (it’s been a while since I’ve been in the bilge making shaft horsepower measurements), the gauges at 45° to the shaft centerline.
It’s not exactly easy to attach the strain gauge to something round :(
Sure it is. Strain gauges are usually flexible and on a kapton substrate. Just use glue.
Gannon is exactly right; strain gauges are flexible. The rosette of gauges is on a common backing, so alignment is easy. For a very small shaft, you’d need very small gauges.
It is hard when you’re standing on an oily frame, with who knows how deep oily bilge water on each side with not enough light adding to the difficulty :) Don’t drop anything or it will begone!
I heard of a patent decades ago that measured horsepower (torque?) of an engine/motor by putting hi-definition encoders on opposite ends of the engine driveshaft,
There would be no difference in encoder readings at standstill or no load, but as the load started to increase the resulting twist of the drive shaft would increase the differences proportionately.
That’s basically how it’s done. The difficulty is that the actual torque fluctuates, especially with a piston engine, and the shaft itself vibrates like a torsion spring, so the encoders have to be really really high-def and measure very fast to be able to pick the signal from the noise.
Aircraft carriers have extremely long shafts between the propeller and main turbines. At full power, the front end of the shaft can be a full turn ahead of the back end. Sounds impossible, but over a length of 400′, the strain isn’t all that great.
At the large scale, many things behave like wet noodles, including steel beams as thick as your leg.
For what it is worth, AC Delco sells some really nice little self-contained, battery operated torque measurement adapters:
http://www.amazon.com/ACDelco-ARM602-3-8-Inch-Measurement-Adapter/dp/B004VYUKTC
Those things are just a block with a few strain gauges on them internally. One of those would be ripe for hacking … not sure exactly what for. Maybe a live dynamometer that measures torque, instead of using a torque arm onto a linear load cell.
Virtually any detailed technique involving relocating components has to be stiffened sufficient which the movements can be managed as well as foreseen although not really that will their independence can be impeded.
Very interesting article about load cell. Strain guage load cell is the most common load cell used to measure the force and loads. It is mechanically measure the loads. It will provide the accurate output and results. Other kind of load cells such as digital load cell, elevator overload sensor, S Type load cell are also provide accurate results and electrical output. Thank you for your great post.
http://sensomaticloadcell.net/