Like many people who have a solar power setup at home, [Jeroen Boeye] was curious to see just how much energy his panels were putting out. But unlike most people, it just so happens that he’s a data scientist with a deep passion for programming and a flair for visualizations. In his latest blog post, [Jeroen] details how his efforts to explain some anomalous data ended with the discovery that his solar array was effectively acting as an extremely low-resolution camera.
It all started when he noticed that in some months, the energy produced by his panels was not following the expected curve. Generally speaking, the energy output of stationary solar panels should follow a clear bell curve: increasing output until the sun is in the ideal position, and then decreasing output as the sun moves away. Naturally cloud cover can impact this, but cloud cover should come and go, not show up repeatedly in the data.
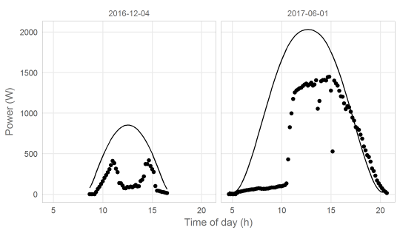
[Jeroen] eventually came to realize that the dips in power generation were due to two large trees in his yard. This gave him the idea of seeing if he could turn his solar panels into a rudimentary camera. In theory, if he compared the actual versus expected output of his panels at any given time, the results could be used as “pixels” in an image.
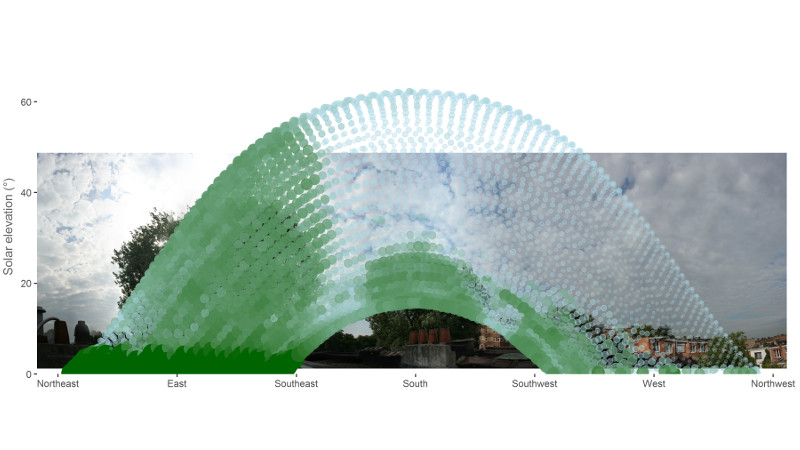
He started by creating a model of the ideal energy output of his panels throughout the year, taking into account not only obvious variables such as the changing elevation of the sun, but also energy losses through atmospheric dispersion. This model was then compared with the actual power output of his solar panels, and periods of low efficiency were plotted as darker dots to represent an obstruction. Finally, the plotted data was placed over a panoramic image taken from the perspective of the solar panels. Sure enough, the periods of low panel efficiency lined up with the trees and buildings that are in view of the panels.
We’ve seen plenty of solar hacks, but this one has to be something of a first. Usually people are more worried about maximizing efficiency or tracking the sun with them.


This is something for all them solar panel salesmen to consider. Actual vs expected output, no kidding!
https://www.google.pl/search?q=solargraphy
very very very inaccurate… does not really take trees into account.
I make a imager a while back. An array of 27 Pin hole cameras made of film canisters, divided into 3 set of 9. Each set given a respective red green blue filter.
I put 9 LDRs in each of them and swept it across the scene with a swiveling plate and a servo for the angle up and down but I expect it would work okay with solar cells too. Maybe calculator ones.
That’s awesome! I have a set of 25 “identical” LDRs that I want to make a camera out of someday (for the last ten years). I was just going to put them in tubes, like a low-res bee’s eye. A pinhole blocks a bunch of light, no?
Post it up? tips@hackaday.com
If you think about this, what you really have is a VERY long term shadowgram scan similar to an old-school TV x-y scan – nothing you’d want to watch The Big Game on.
The sun is effectively a single point and the sensor array records its amplitude as it sweeps across the sky daily, and up and down the ecliptic seasonally. This has been done with pinhole cameras over a long period as well, but this is an interesting use of data.
This seems like it would appeal to someone wanting to converge a simple sensor, their favorite cheap board and an SD card for a long time.
I imagine with all the bad weather solar panels aren’t doing so good.
Late last month, I was forced into running my server cluster totally on solar for a few days… because the fan in the mains PSU died.
It’s cold here, but sunny!
I was reminded of a passive tracker for solar panels that use Freon, mirrors and 2 bearings. With tracking the panel out is near the “ideal” curve.
http://www.oasismontana.com/zomeworks.html
s/out/output
Imaging the Neighborhood? This is one of the most mislabeled hacks I’ve seen in a long time.
Everything read psycho.
He didn’t see those three (3) trees and their shadows BEFORE starting to analyze why there are data anomalies??
Generally curious as to what you call the buildings/trees/etc that surround your home if not “neighborhood”.
Close proximity dwellings? Localized structure collective? Near Field Foliage?
There used to be a device sold to the solar installers that would make an image of this before you sold the system to make sure there was enough clear sky to make it worth installing.
One of the conditions for our off-grid PV+battery subsidy was that we could be audited at some stage, which we duly were. The auditor checked that the installation complied with code (it did), and he used a specialised data logger/computer to determine the theoretical efficiency of our system. Our panels face north (nearly, the house is about 4 degrees off true north) and sit at ~26 degrees from horizontal, roughly equivalent to our latitude, so they’re optimised for best performance during spring and autumn – the sun at noon in the middle of spring and autumn is perpendicular to the panels, or very nearly so.
The data logger was about the size of a small laptop – it included a GPS receiver for precise location, and a camera with a wide-angle lens. He input some data – PV details, etc. and set the logger at the top of the panels, and pressed a button.
He sent me a copy of the report. It included the lat. and long. and a print of the image that the camera took – it was a real wide angle, it must have been almost 180 degrees – the image went from horizon to horizon, and showed the view of the sky from the panels’ perspective, including any obstructions from trees. He said our system was 94% efficient – meaning that there was little obstruction, despite there being lots of trees in the west. He said that by the time the sun was obscured by those trees, it was at a low angle anyway and not capable of producing a lot of energy in the panels. There are also variations in the height of the treeline that affect the time when the panels start to become shaded.
Next up: solar panel security camera, hiding in plain sight :)
Please tell me I’m missing something here.
While the data manipulation has interesting aspects… It seems like a _very_complex way to figure out that trees are shading your panels.
It wasn’t trying to discover that the trees were shading his panels.
It was “I’ve got a year’s worth of power generation logs, can I do anything interesting with it?”
There are dozens of Solar Site Survey generators out there.
You could draw one by hand if you have the right references on hand or open in your browser. Basically a sheet you print out specific to your latitude, set it on a level surface at the height where you intend to put your garden or solar array and then scan around with an clinomeeter with a pencil on the end, tracing the canopy and buildings in your skyline. Then you look at the trace and see if your desired location has the best view of the sky, if not move to another location and repeat.
Here’s just one to explain the concept better and with pictures.
https://www.builditsolar.com/SiteSurvey/site_survey.htm
Or you can simply base where the best location is by using your own observations of whether or not the site ever gets any shade.
Sure but that takes at least a couple days to put together and doesn’t translate well through the seasons. An obstacle / horizon survey with a latitude appropriate chart tells you how the site performs throughout the year after an hour or two of fiddling (much less if you’re familiar with the tools).
The survey method is more useful if you’re not familiar with the site. No doubt you can get serviceable results from just eyeballing it, but a survey will get you the best site on a property for not much investment in equipment or time..
though there are solar pathfinders available to easily see the trajectory of the sun through a certain area and estimate possible shading issues using your microinverters to gain real world data is a wonderful asset to make sure the pv salesguy didnt sell you snake oil
With a small sensor (~1 cm^2 pyanometer) and a short time step (1 min), you can get fairly high resolution (enough to make out nearby power lines).
See slide 7 in this presentation: https://www.slideshare.net/mobile/sandiaecis/04-final-hobbs-lave-wvm-solar-portfolios-pvpmc
That’s really cool. Not surpsing, just cool. :)
when you go through his blog there is a lot of information in there I found the path the sun makes each hour throughout the year rather interesting.
Thanks for this man. I’m looking for an articke like this.