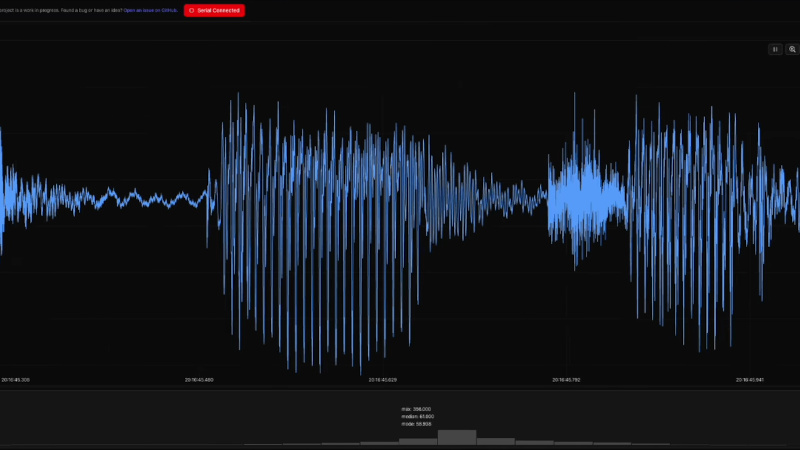
If you’re working with a microcontroller that reads a sensor, the chances are that at some point you’re faced with a serial port passing out continuous readings. The workflow of visualizing this data can be tedious, involving a cut-and-paste from a terminal to a CSV file. What if there were a handy all-in-one serial data visualization tool, a serial data oscilloscope, if you will? [Atomic14] has you covered, with the web serial plotter.
It’s a browser-based tool that uses the WebSerial API, so sadly if you’re a Firefox user you’re not invited to the party. Serial data can be plotted and exported, and there are a range of options for viewing. Behind the scenes there’s some Node and React magic happening, but should you wish to avoid getting your hands dirty there’s an online demo you can try.
Looking at it we’re ashamed to have been labouring under a complex workflow, particularly as we find this isn’t the first to appear on these pages.


https://github.com/hyOzd/serialplot/releases/tag/v0.13.0 there is a standalone program that works great that should have been mentioned. fearures : multiple chanels ,ASCII/binary format and many more features.
According to the Firefox users – don’t worry, just install the WebSerial for Firefox
WebSerial API Polyfill for Mozilla Firefox browser – I’m using it for a while and it is working (also with Better Serial Plotter).
Thank you but I’ll stick to matplotlib and pyserial. It’s already incredibly slow, i don’t want to learn JavaScript AND get an even slower inference
I would not be so sure about it. JS is fast, well optimized, and webserial is quite a short path. I would bet you can easily beat Python with it. And if not, webasm definitely would.
react, though :)