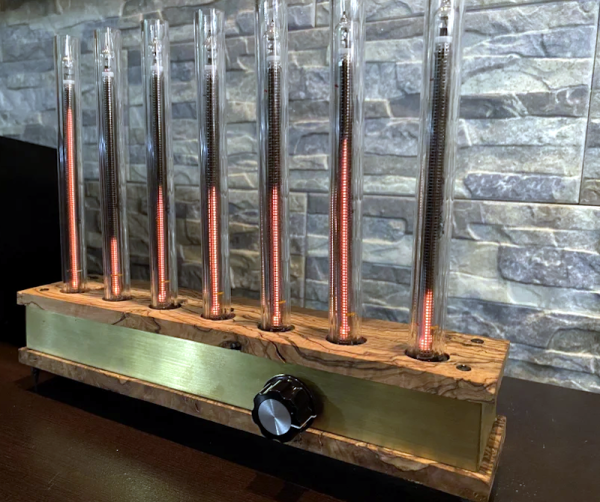
A spectrum visualizer is always a fun project, but we really liked [Yannick99]’s take on it since it uses seven IN-13 Nixie tubes for the display. The tubes, of course, need high voltage so part of the project is a high voltage power supply. The spectrum part is a little more ordinary using an op amp and an MSGEQ7 filter IC.
The chip feeds a microcontroller and the microcontroller, with a little help, drives the tubes. The results are great, as you can see in the video below. There are several other videos showing the testing and prototyping, too. The MSGEQ7 is a cute chip that offloads the usual FFT logic from the microcontroller. It does all the work and communicates in a very unusual way. You reset the device and then pulse the strobe input. This causes an analog voltage to appear on the output pin corresponding to the 63 Hz band level. Another strobe pulse selects the next band and you just repeat indefinitely, something the microcontroller is good at.
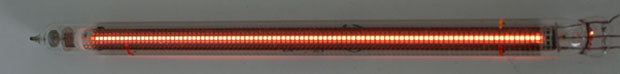
The only issue, of course, is locating IN-13 tubes. They are around if you look for them, but they may not be cheap. Expect to pay about $20 each for them, more or less. We wondered if you could make an LED look-alike replacement. If you are wondering about the lifespan of these tubes, someone’s already done the testing.