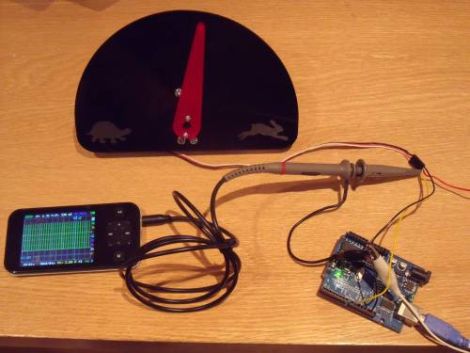
[Greg] built himself a small indicator dial with his laser cutter, and wanted to use it for visualizing server performance and load information. Before he started using it for server monitoring however, he thought he should test out his data parsing skills on a simpler data set.
Pachube has a wealth of information that can be freely used for whatever project you might have in mind, so [Greg] started looking around for something interesting to track. Eventually he located the data feed for a tanker ship and wired his dial to display the ship’s speed. He uses a Python script to interface with the Pachube API, which is fed to his Netduino board. A servo motor then changes the position of the dial based on the feed’s data. Since large tankers don’t change speed often, the experiment was a bit of a letdown. He searched for a bit and tuned into another feed that tracked wind speed in New Zealand, getting much better results.
His future plans include hooking it directly to his network and eventually using it to monitor his servers…at least once the novelty of tracking random data feeds wears off.
All of his code is available on GitHub, and he is happy to make a gauge for anyone who is interested, though he doesn’t currently list a price.


