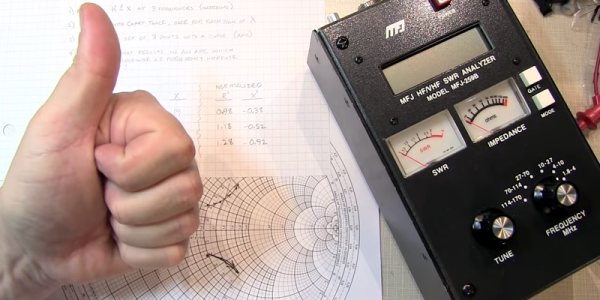
Impedance matching is one of the perpetual confusions for new electronics students, and for good reason: the idea that increasing the impedance of a circuit can lead to more power transmission is frighteningly unintuitive at first glance. Even once you understand this, designing a circuit with impedance matching is a tricky task, and it’s here that [Ralph Gable]’s introduction to impedance matching is helpful.
The goal of impedance matching is to maximize the amount of power transmitted from a source to a load. In some simple situations, resistance is the only significant component in impedance, and it’s possible to match impedance just by matching resistance. In most situations, though, capacitance and inductance will add a reactive component to the impedance, in which case it becomes necessary to use the complex conjugate for impedance matching.
The video goes over this theory briefly, but it’s real focus is on explaining how to read a Smith chart, an intimidating-looking tool which can be used to calculate impedances. The video covers the basic impedance-only Smith chart, as well as a full-color Smith chart which indicates both impedance and admittance.
This video is the introduction to a planned series on impedance matching, and beyond reading Smith charts, it doesn’t really get into many specifics. However, based on the clear explanations so far, it could be worth waiting for the rest of the series.
If you’re interested in more practical details, we’ve also covered another example before. Continue reading “A Gentle Introduction To Impedance Matching” →


