A few weeks ago, [Debarghya Das] had two friends eagerly awaiting the results of their High School exit exams, the ISC national examination, taken by 65,000 12th graders in India. This exam is vitally important for each student’s future; a few points determines which university will accept you and which will reject you. One of [Debraghya]’s friends was a little anxious about his grade and asked if it was possible to hack into the board of education’s servers to see the grades before they were posted. [Debraghya] did just that, and was able to download the exam records of nearly every student that took the test.. Looking even closer at the data, he also found evidence these grades were changed in some way.
Getting the grades off the CISCE board of education’s servers was very simple; each school has a separate code, and each student is given an individual number. With the simplest javascript magic, [Debraghya] discovered that individual grades could be accessed by pointing a script to /[4 digit school ID]/[3 digit student ID] on the CISCE server. There was absolutely no security here, an impressive oversight indeed.
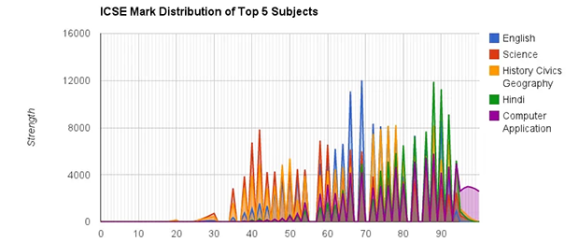
After writing a small script and running it on a few machines, [Debraghya] had the exam results, names, and national IDs of 65,000 students. Taking a closer look at the data, he plotted all the scores and came up with a very strange-looking graph (seen above). It looked like a hedgehog, when nearly any test with a population this large should be a continuous curve.
[Debraghya] is convinced he’s discovered evidence of grade tampering. Nearly a third of all possible scores aren’t represented in the data, but scores from 94 to 100 are accounted for, making the hedgehog shape of the graph statistically impossible. Of course [Debraghya] only has the raw scores, and doesn’t know exactly how the tests were scored or how they were manipulated. He does know the scores were altered, though, either through normalizing the raw scores or something stranger and more sinister.
While scraping data off an unencrypted server isn’t much of a hack, despite what the news will tell you, we’re awfully impressed with [Debraghya]’s analysis of the data and his ability to blow the whistle and put this data out in the open. Without any information on how these scores were changed, it doesn’t really change anything, and we’ll welcome any speculation in the comments.


Newsflash: Indian IT quality poor and output untrustworthy. Anyone who’s been involved in outsourcing has known this for a while.
This is a security lapse that requires the entire IT department to be hanged with their own mice cords!
Hacking != Cracking
And this was nither. He did not hack or crack. he simply scripted a way to access the freely available data faster.
This was both. He hacked the code together to retrieve data. Data he did not have express permission to access. Thus he Cracked the (almost non existent) security system. True both were very trivial jobs.
You can see that Information Science students scored better than all other students – this clearly shows they are smarter than all of them (or that Debraghya was not the first one to discover that there’s something wrong with the server ;-)
In the other news: Debarghya Das has been charged of crimininal conduct and banned from any university, the state minister say’s there is absolute no problem with the scores and they will procecute him to the full extend of the law for this “illegal hacking”.
Above will become true in 3…2…1
Or, ya know… Google hires him.
seen he’s an intern at youtube i hope they do :)
If this is all it takes to be hired by google I should be a goddamn billionaire!
We don’t need more HB1’s
But would it be considered “illegal hacking” if all the information was published and readily available to anyone with the correct url? A common definition of hacking is “to gain access to a computer illegally” but he did nothing (at least nothing that I’m aware of) illegal to gain access to it.
That’s a good question.
http://www.wired.com/threatlevel/2013/03/att-hacker-gets-3-years/
Maybe you should ask Weev.
I hate it when I see cases like this… while I don’t like the idea of someone freely grabbing personal information (there is a market to buy it after all) I have an issue with the charge… “one count of conspiracy to access a computer without authorization” He was granted authorization, it was just authorization without authentication. The same reason why the military doesn’t use RFID access badges without a PIN.
After reading the article it looks like they were being malicious and they were not authorized to access the computer and they even bragged about it. If you don’t want to go to jail then don’t be a tool. If you exploit things you may get busted, I have no problem with that. Also, who uses GET anyway. POST is a much safer method. Maybe AT&T outsources code to India too.
Not really, you could script POST data with curl or netcat all day long.
Aside from the appearance of their malicious activity, the server that was hosting the files did authorize their activity. While I’m sure any intelligent court system would see right through, you could say that the only blame should fall on the dim witted security department that failed to establish any form of authentication. That’s just my two cents…
I think you are confusing machine authorization with human authorization. They were not authorized by AT&T or in the case of this article by the proper people. If I know your computer password then I can be authorized by your computer to use it but that does not mean you authorized me to use your computer. In a similar fashion if I unlock your house door then the door authorizes me to open it but that doesn’t mean you authorize me to open it so I could be guilty of trespassing or B&E. Playing the ignorant card is not an excuse. If people want to play russian roulette with their freedom then go ahead. If I was on the jury then you would be a criminal to me and many other people.
True but if I were to put my computer in a public place, full access to everyone, no password, etc then it would be reasonable to suspect that I am granting you authorization to access it. Its a grey area and while common sense would dictate that he was not granted access, common sense also dictates that you don’t allow access to everyone unless you intend someone to use it.
And unlike my home, AT&Ts website is advertised to entice people to go to it. If I put a big sign in my yard asking people to come and hang out in my yard all day and night but then didn’t lock my door, I would expect someone to eventually come in to use the bathroom.
After looking back at this and remembering my PII course technically ATT should have been fined for each piece of PII data (personally identifiable information) that they failed to secure. Regardless of what happened to the guy that accessed it, ATT failed to follow best practices in the personal data of their subscribers… just saying…
Or Aaron Swartz: http://en.wikipedia.org/wiki/Aaron_Swartz#PACER
Oh wait…
Swartz physically trespassed in order to gain access to a wired network. That’s very different.
That depends on how much money you have to spend on lawyers. Rich = it was not a crime. Poor = it was an act of treason and you must die for your transgressions.
The actual legal definition of hacking* in this post-DMCA et al world is to access data *without authorization*. And that doesn’t mean the technical sort of authorization, like “this temporary user account is inexplicably authorized to access this data.” Authorization in this context means that you as a human being were intended to be able to access the data by the other human beings who put it up there. Rightly or wrongly, “the data was put up for anyone to see on the internet” is as effective a legal argument as “if he didn’t want me in his house he should have closed the front door.” It all hinges on highly legalistic and technical details of the particular case, such as whether an imaginary, legally-defined “reasonable person”** should/would know that he/she/it should(n’t) be accessing it. In this case I suspect there’s a legal obligation to say “whoah, I shouldn’t be seeing this” and back away slowly, but I’m not fucking Indian.
* As I, a non-lawyer who reads a lot and has taken a couple college courses on law stuff in this specific field, understand it
** What I’m getting at that reasonable person in this context absolutely does NOT mean “a person who is reasonable.” It’s a legal standard determined by caselaw.
“if he didn’t want me in his house he should have closed the front door.”. The door might have been opened, but he didn’t walk in. All he did was took a peek from the street.
There could be a legitimate explanation. For example, if a particular exam consisted of exactly 50 yes-or-no questions, and the scores were expressed as percentages rounded to the nearest integer, nobody should have an odd-numbered score. You couldn’t get exactly 75 percent correct, because that would mean answering 37 1/2 questions correctly. The saw-toothed appearance of the graph above leads to that as a likely explanation.
Except that there are a FEW even numbered scores in the “banned list” as well as a few odd scores in the possible list. So, the facts only ‘mostly’ support the theory. There is certainly something fishy attached to a possibly otherwise legitimate system.
These exams are subjective. There are hardly any objective questions, so no Yes-or- No questions.
Were they finished processing the data before he hacked their site?
Did you not read the article? he did not hack the site.
really guy? its a matter of semantics, I think using a little logic you could gather what I was saying.
Oh, he hacked the site… but what he didn’t do was crack the site.
the reason for the hedgehog could in the scoring system, when marked, the bulk of the points are marked in blocks or groups of points for a question(in my courses its typically 5 points) students will typically get 5 for perfect + extra research shown, 4(which is rarely given) for good answer decent research, and 2.5 for adequate, and 0 for no attempt/wrong answer, which leaves plenty of room for many point numbers never to be hit in the final scores.
It doesn’t work out if you read the entire post it explains why. How can you add up a bunch of random marks and end up with a random set of marks never achieved hundreds of thousands of times? Anyway, interesting use of the central limit theorem.
What this shows is that the standardised marks are related to raw marks in a complex way and doesn’t really suggest anything sinister. I really can’t imagine any benefit from adding or dropping marks for everyone scoring certain values.
maybe it does,
If there were only 33 questions in the paper then you only get multiples of 3%.
Wait really? You cant imagine any benefit? Consider that these two test boards determine ALL college entrances in the country. You don’t think regional administrators don’t push grades up to get more of their students a chance at college, or that, in some cases, they push grades down for regions and groups of people they consider ‘not college material?” I am not sure how student assistance comes into play, but when you have 50 students and only 5 loans, how would YOU decided who gets them? Certainly some level of ‘favorites’ might come into play, or ethnic/regional bias.
It would be very strange if the regional administrators all independently changed the grades in the exact same way, and the same for every subject. If they’re changing grades by 1-2 points, why did nobody bump any 92’s or 94’s to 93’s? Seems more likely that the questions were worth 2 pts each and the graders sometimes gave out part marks. It would make sense that they would bother more about part marks on the very high and very low ends because the difference between 96/97, or 34/35, will mean much more to a student’s future than 46/47. A bit sloppy for the grades in the 35-93 range, but not sinister. It’s interesting that he never mentions asking his junior friends if the format of the tests would allow for this kind of distribution.
This guy spends a lot of time hyperventilating about the jagged graphs and not nearly enough showing insight into the Indian education system.
I got into an arguement with with an Indian bloke who swore the broken English he and many from India speak is a “dialect” of English and that they speak English better than people from England…I face-palmed…hard, I’ve met plenty of people from India who speak actual English and well, but way more who speak English really badly, and think they are kings of it..
Your broken English is astounding.
There actually is a dialect of English specific to India. It has lots of weird quirks, like using “doubt” as a synonym for “question,” like a teacher saying “does anyone have any doubts?” I don’t know shit about its grammar, but I get the feeling neither do you.
Judge not…
Or “I have a doubt about the foo class you wrote in bar.cs”. It kinda used to trigger a certain emotion in me, but now i’m used to it :)
Not sure what the supposed scandal here is – most school boards in most parts of the world (certainly the ones I’ve studied in) will deliberately normalise the scores to make them fit some arbitrary curve, do so publicly and make no apology for it. In Australia, for instance, your university entrance is not decided on your marks but on your “Tertiary Entrance Ranking” – a number between 0 and 100 indicating what percentage of students performed worse than you. The density function for this ranking is a flat line – somewhere, someone gets 0 and somewhere, someone gets 100 and everyone else is evenly placed between them.
There’s a huge difference in the case you mention, simply because the process is transparent.
There is no evidence that this is not equally transparent. All he’s found out is that grades don’t fit the distribution you’d expect and leapt to the conclusion: “Tampering!” “Fraud!” But those are accusations of criminal or nefarious intent, when all he has evidence of is making changes.
No-one, as far as we can tell, has actually bothered to ask for the education authority’s take on this – their response could well be, “Well, duh, go read our policy document – we’ve followed it to the letter.”
If I ran the education board, I’d be reaching for my lawyers – pretty clear-cut case of libel.
What distribution does he expect the scores to follow? When I hear “statistically impossible” I think “you need to re-examine your expectations and learn a little more about exactly how these courses are scored.”
Without manipulation or some oddity, it IS statistically unlikely in a sample this size. The majority of odd scores are absent except in the very low and very high scores, and only specific even numbers are unrepresented.
Seriously, unless there was a strange quirk in the grading algorithm, why did no one in the entire country score a 56?
Perhaps it is caused by a conversion between letter grades on paper and the numeric grades in the system?
You wouldn’t have the slope on the spikes in that case, you would just have spikes with no data in between.
The slope on the spike lines is just a graphical transition, it’s not actual data points. There are scores at 40, so there’s a point at some value, but there are no scores at 41, so the line has to transition down to 0, then back up to some number for 42.
I thought about that too. Maybe grades below 96 gets normalized to avoid parent’s whining about how their child didn’t enter some college by 0.10 points. The minimum grade threshold might follow a standard so if some school won’t accept 77 points and below, nobody can get grades between 76 and 79. Then they would say “You didn’t enter by 2 points” and it would be harder to complain.
96 and more would not get normalized because anyone above 96 would enter any school. These real grades then could be used to make the top scores list on any school, since they’re expecting that any school would have at least 20 or so students above 96… then, nobody would realize they lower grades got normalized, and the top scores would be able to compete for the first places and glory of… just numbers.
Also concerning is that almost all the top results are for “Computer Application” (wtf is that?! I’ll guess that’s something like CS poorly translated), while other subjects, notably science, maths (data via the link), and even Hindi, get much lower scores. As he notes, 50% of their “Computer Application” mark is given by the teacher. In the UK, the boards notice and investigate odd distributions where marks given by teachers (e.g. in lab work). A teacher of mine who artifically inflated lab marks for people on the C/D borderline made sure to have a good distribution by taking marks off those of us who were solid A grades and at no risk of messing up in exams. We knew it was going on, but we’d still get our A grades as we were getting 95+% in exams, and our mates would get to uni, and he was otherwise an excellent teacher…
It looked like a hedgehog, when nearly any test with a population this large should be a continuous curve.
The hedgehog is probably because the grades were rounded to the (closest) integer.
Yes, you’d expect a skewed Gaussian, but the exams are probably graded by different people so the best you get is a Central Limit Theorem approximation of a normal distribution.
There are about 3 interesting things about these graphs, some more suspect than others.
1: The ‘hedgehog’ shape. This is less suspect than it might appear – imagine how you would scale, say, a paper marked out of 66 to an integer percentage. Some numbers would be missing, or else it would mean that same graded papers would lead to different percentages. It’s not some weird combination of individual question marks- he disproves this in Analysis 3.
2: Large gaps below the pass boundary. Yeah, this is bad. He calls them ‘Grace marks’ and it’s pretty damning.
3: Not-normal distributions. There’s probably been some tampering here, to fit the grades to a normal distribution – e.g. only one person has 100%. (It would have to be a perfectly designed question paper to achieve this). This problem is probably not so bad- you would expect most people to pass, and it’s pretty standard to bodge results into a normal distribution.
So in summary, the main problem that I see is that of the ‘Grace marks’. The rest are fairly sensible things to do, unless the papers are marked out of 100 real marks.
Other explanation for the hedgehog : imagine every question was marked 2 points, except for the last few difficult questions worth 1 point each.
Most student will only work with 2-points questions, but only the best ones will answer the 1-point questions, hence the continuity at the end of the curve.
3: Not-normal distributions. that means the paper’s too easy. At uni, if anyone ever got 100% on a paper, the lecturers (who set the exam questions) were all reamed out; it happened in my first year.
I suspect that the region of 95 to 100 is due to its importance. I.e. scoring a 99 versus a 98 is going to be far more important than a 64 instead of a 65.
The not-normal distribution is fine, as you said, as you’re expecting most students to be able to pass grade 10 (and grade 12, although failure rates are higher as expected).
I agree the grace marks is the ugly part. Until/if I bother to plot the raw data up myself though, I’m partially skeptical of his analysis.
Universities typically have a ‘pass conceded’ type deal at 45%. Perhaps this exists in this Indian system (and is just applied to the raw data and, for whatever reason, is not explained/disclosed to anyone).
Wouldn’t you get the hedgehog shape, if you queried a database that rounded up all values to even numbers, and then displayed the results on a graph of all numbers?
This would mean that the even values would be approximately twice as high as they should be and odd numbers all equal 0. Thus creating the hedgehog shape.
yes, but that’s not what’s happening, as the top few marks are all present.
As for the 95th percentile and up, I could understand the desire of the educaters to want to record more granular amounts of data.
BTW.
Most likely all data in the database is probably stored correctly, but the web results were rounded up.
Although this is concerning, it does not itself prove tampering. First of all we need to know the scoring system. It is not unusual for exam boards to use highly complicated scoring systems, for example It may be that each paper is scored out of an unusual number such as 37, then due to rounding errors certain scores are unattainable. If on top of that another rule was added, such as additional points being added (as a percentage) for spelling and grammar, it could mask the original distribution very well, making a graph like this appear.
This could be even more complex due to additional terms such as spelling and grammar points only being awarded for scores above x%. In addition it is not uncommon for papers to be marked twice and the student be awarded the higher of the two marks. This is to try and spot then subsequently reduce bias from certain markers. This practice of remarking may be used even more around significant grades such as pass marks.
I would say that the seemingly random nature of the missing marks, yet the fact that within a certain range they are fairly evenly distributed would give strength to this idea. The missing marks for example do not crowd around significant grade boundaries (not that we know what these are).
If we knew more about the papers and the grading system we would be able to do more analysis. We simply do not have enough information to conclusively prove that the marks are tampered with. We need to know how marks are awarded, what for, any marking guidelines given to markers and finally what the grade boundaries are or otherwise what the significant scores are.
so he took down the raw data but he left up the scripts to grab it using a zillion requests. people will get the data and the servers are just going to get slammed hard.
you think it’s bad when you get hackaday’d/slashdot’d… just wait until you get 50+ different people datamining your site!
All these posts and no mention of Ferris Bueller’s Day Off? I’m shocked!
check the tags.
I honestly don’t understand how this is HAD material.
This is the most basic of hacks, and then he makes assumptions based upon the query results provided by the webserver.
More than likely ALL data is recorded correctly. The website results are provided by an unknown SQL query. The results are probably rounded up to even numbers, and the top 5% is provided as well for a more granular view of the data.
Taking this data and graphing it with a value of 0 for all odd numbers, will result in a “Hedgehog” graph, with the top 5% being displayed as complete.
There are missing bands of data in the graph, but I could easily attribute that to a timeout in the query results of DebraGhya’s javascript code.
So, Overall this is an amateur hack at best, and without seeing the source data is purely speculative.
Brent, One at a time:
(not a hack) – well sure. I mean, he EXPECTED it to be MUCH harder to scrape this data. Had the board of education put up a fight with some real security, he could have “hacked it” in order to demonstrate his hacker skills to you. So, in essence, the board of education let you down, not Debarghya.
(unknown SQL/rounding, top 5% granular view) None of those things should be happening. This is not a query of ‘approximate test scores’ or ‘how did India do?’ Its MY test score. Its YOUR test score. An individual should be able to query their precise test score. Given that he posed as thousands of individuals and queried their exact score, the data is in fact valid. No one in India scored a 55 on the test. Pretty straight forward. No assumption is being made on that point.
As to assumptions being made on the data results, well sure. All he can do at this point is speculate. But I suspect he has a much better understanding of how the tests work and at least a test taker’s view of how they are scored, seeing as how he took the test at one point in his past, and it was a conversation with two of his friends awaiting results that sparked the project. What I am saying here is “he may not be fully qualified to speak as to how the score system works, and assumptions that could be made by this data, but he is FAR MORE qualified than you or I to do so.”
(graphing the hedgehog) People need to read the post COMPLETELY. There are both even and odd numbers on the banned grades list, and the same is true of the possible grade list. This is NOT a case of even/odd rounding. At least, not without some other wacky stuff being done to it in post grading.
(missing bands/timeout queries) Um.. Really?!?! A mark is a mark. A retry would return the correct value eventually. Only a small handful of the tests did not get scraped, and it is HIGHLY improbable that the query would happen to timeout EVERY time it was meant to return a grade of 57. That makes absolutely no sense at all. You would have better luck claiming it is possible the script itself mucked up grades or dropped certain data points. Really. I am sorry, but that statement was just puredumbstupid.
(Amateur hack/speculative) Well.. maybe it was an amateur hack. But then, the board didn’t put up much of a fight now did it. But, buy your assessment, blowing a captain crunch whistle into the hand set was an amateur hack too. The effort of the technique does not classify something as amateur or professional. The impetus to do something, and the ingenuity does. Having prepared himself to hack the system, he was utterly shocked to find that the gates were wide open. So what. The technique required turned out to be incredibly simple. But he discovered so only after accepting the challenge.
As for it being speculative at this point. I can certainly agree with you there. I dont have the data in hand to verify that he himself did not tamper with it before posting it, nor do I know enough about the testing system and how those grades affect college entrance to make my own assessment. So yes, we are all speculating. Whats wrong with that. Can you find a legitimate explanation for the evidence? That is half the fun.
> Implying that if there had been any real security he would be able to break it (I know him).
Everyone’s going with a similar theory that the gaps are due to rounding up an odd scoring system. It could be that you pay a bigger bribe for a higher score and the peaks coincide with the denomination of notes. (There’s obviously room for negotiation when it gets to the top marks.)
I am quite interested in the no man’s land around 55 percent. There is a WIDE tooth gap there in EVERY test subject. It’s kind of strange. 55, 56 and 57 are impossible scores. Not consistent with the odds/evens theory. I cant think of any particular scoring system by which it would be impossible to get at least ONE of those scores. No other gap is that wide.
It makes me wonder how that score sets with acceptable scores in universities or trade schools in the country. Imagine for a moment that 55 is considered passing scores for entrance, while 54 is not. Then:
1: The test is scored in such a way as to eliminate ‘borderline’ scores to reduce ambiguity. OR
2: Administrators have pushed scores up and down so as to eliminate borderline scores
Just a theory. I don’t know how the scores of the tests relate to actual acceptance to universities.
In testing, with population numbers as low as 100 and as high as 20,000, there are often ‘natural gaps’ which occur in test scores frequently. Some are due to natural clustering, these could be due to a particular question not covered or with an error on the key. I wouldn’t be concerned by what I saw.
I could accept that theory on ONE test. For example, English. Ok, its a bit odd on the surface, but not unrealistic that no one scored 55, 56 or 57 on the English test. I would be right there with you. Ok fine.
But on EVERY test (math, science, Hindi, English and History), the same three numbers? That is no longer a measure of populace skill with the given subject, that is a clear indication of the scoring system. Nefarious or legitimate, I don’t know.
To be clear, here is the list (copied from the post) of unattainable scores on EVERY test subject:
“36, 37, 39, 41, 43, 45, 47, 49, 51, 53, 55, 56, 57, 59, 61, 63, 65, 67, 68, 70, 71, 73, 75, 77, 79, 81, 82, 84, 85, 87, 89, 91, 93. Yes, that’s 33 numbers!”
Note that it includes both even and odd numbers, so simple rounding is unlikely. There are 5 strings of two consecutive numbers, and 1 string of three consecutive numbers.
Also, I found that he states that 35 is the passing score. But curiously, 32, 33 and 34 were also unattainable scores on all tests. This means you either FAIL with a 31, or pass with a 35, 38 or higher. This supports my earlier posted theory that either the scoring system is designed to dissuade ambiguity around the borderline score (“but I was only 1 point shy, c’mon, let me into college”) or that the administrators are doing so. Again, only a speculative theory, but its plausible.
No need to speculate – you’re right. I’m an Indian, and I have first hand knowledge of this exam. They do have a margin of error of 3 marks – people who score 32,33 or 34 – their scores get reset to 35. Its called “grace marks”.
The same thing also applies to people who miss a first class degree by 3 (or less) marks. They get 3 extra as well.
The fairly regular gaps can be explained by converting tests of say 40 marks to a scale of 100.
The wider gaps can be explained by avoiding placing anyone near a grade boundary.
The greater variation near the top can be explained by altering the scale conversion near the top to not produce gaps.
I can certainly understand the motivation for scoring it such that no-one appears to miss a grade by 1-2 marks. It would:
* leave students feeling better – noone has that horrible feeling when they only just missed a grade
* save a fortune on people demanding remarks when they missed by 1-2 marks (or if you have to pay to get a remark, at least save a lot of time for the exam boards. In the UK you can demand a remark if you’re near a boundary; you only pay if your remark comes out different)
* save the universities a load of grief from people pleading for a place when they “only missed by 1-2 marks”.
I think the bigger problem is that the grades for computers were *much* higher than other subjects, when computers is a specialist subject, and everyone should be able to handle Hindi The test for computing appears to be much easier than other subjects, or as he suggests, teachers are falsely inflating the 50% of the mark they control for that subject.
BTW, has anyone seen if the exam boards have responded yet? I don’t speak hindi, but I imagine a hindi speaking news network might have something?
I would imagine, in today’s computer literate Untied States, that such a test of computer skills and knowledge might be child’s play for high school students – it’s what many of them do with all of their free time and only a small fraction are unfamiliar. English, on the other hand, is “boring” and requires real work. Add to it that as computer literacy goes up among students, it is somewhat likely that English scores go down due to webspeak. I can see that particular score discrepancy happening here, I don’t know enough about India to say about there.
Oh, here’s an example – my community college has no way to register for classes without a fairly long trek through a web interface. The counselors can’t even do it for you, you must go through e-services and, at most, have someone stand over your shoulder as you muddle through it. Most of the time, only the older (25+ mostly) adults going back to school struggle with this system, because account creation, form filing, and internet search is such a basic part of living on the internet.
There’s also a digital learning system that many professors require use of, which dooms students with computer literacy problems to drop or fail – they don’t accept papers handed in, for example, or all the testing is done online.
25+ is older? damn…
For college? Yes. If you go to school right after high school, and don’t fail a ridiculous number of classes, you should be able to graduate from most bachelor’s programs by 22-23. If you take a gap year that’s still only 23-24. To be a 25 year old in a bachelor’s program, you would have to work for several years between high school and college, or fail an awful lot of classes.
I guess that makes sense; I suppose I was assuming it was something like a CS A-Level in the UK – which is actually pretty specific and hard, covered stuff like DB normalisation, etc., whereas “Computer Applications” might be an accurate translation and suggests more of a basic computer literacy test… though I’m still surprised by the marks being that high, given the number of my collegues who think that you centre something with the space bar.
I think it would be really interesting if he were to graph the data by school and by geographical location. As a further step, he could compare this graph against economic information and poverty levels for a given location. It might not prove anything, but I would be very interested in seeing the results.
Drawings the wrong conclusion IMHO. Continuous curve would be expected with a homogeneous sample population. India is the textbook example of a stratified society with economic castes. If you examined American SAT scores as a whole, you would see similar hedgehog distributions drawn along racial, gender, geographic, and economic demographics.
That would result in a bimodal or multimodal distribution. What this shows is *no one* getting certain scores.
Yeah, technically this is a multimodal distribution, but it’s astonishingly improbable that no one would get a score of 85.
So, how soon will we be seeing these scores up on facebook pages of young people from India. (In line with Facebook’s policy of publish every scrap of data about you they can get hold of.)
He should have used bar charts, not line graphs (if the data is discrete (can only get integral scores) then it should not be graphed as if it were continuous).
One would still get a spiky graph, but the edges of the spikes would be vertical.
Might be interesting to analyze by sub-groups (e.g. by schools) to see if some of the extra spikes are localized. (By extra spikes I mean how history, for instance, has much higher marks between 70 and 80 than for spikes on either side of that range).
He should have used pie charts, everything is better with pie :P
Someone I know has to convert all data to pie charts to present to management, as line graphs etc. are ‘too complex’ for them, they prefer pie charts.
I like hedgehogs…
Why did he had to call out the names of his 2 friends? Suddenly, they become his partner-in-crime. He may have got them into a lot of trouble.
High school exams in India have a pattern unlike other (western) countries afaik. High school exams are graded for 150 marks for paper (written) exam and 50 for lab (practical) exams. These get added and then converted to 100. Also the mark/question is not even like western once. There may be a few huge ones that have 10 marks each. You will have to write for pages to get a perfect 10 on these. Few, like 10 might be 5 marks each. There will be lot of 2 mark and 1 mark ones. Any one that actually wrote this exam should be able to post the pattern here. And unlike western exams, Indians get VERY few objective types. For most questions, you need write within a range of certain number of words.
s/mark/score/ if you do not understand what a mark is or if you are from a western country.
What you see here is a few different effects.
1, the student can’t use a bar chart properly, but putting up the stupid line chart he’s exaggerated this hedge hog effect. given that you can’t get half marks, a continuous line is not appropriate for this chart type.
2, whilst he makes the argument that is marks 98,99 and 100 are possible there must be both one and two point questions therefore it MUST be possible to get every question he fails to account for the fact that those who got 100 answered much more difficult questions, and therefore it can be possible to only have certain questions likely.
of a 50 point exam
e.g questions 1 – 48 = 2 point questions that are easy
questions 49, 50 are single point questions of reasonable difficulty.
Questions 51 and 52 are single point questions of fiendish difficulty.
Most people would only get even point scores, however it IS possible that a person may have gotten relatively trivial things wrong and still be able to answer a single point more difficult question because of a single remembered fact.
in this example getting 48 out of 100 is more likely than getting 49 out of 100, EVEN though Gaussian distribution would suggest that 49 IS statistically more likely than 48!
3, “grace marks”, Boundaries are likely to attract less students present at them, IF a person grading a paper has grade boundaries at 10% intervals, they will usually remark papers (rechecking both the students work and their marking/grading) IF a student gets 88 or 89%, hoping to be able to mark them to the grade boundary, (90%) this may involve being more lenient and accepting that the student did know what they were writing, but did not convey their methodology as well as they perhaps could, (e.g knowing a formula and using a formula but not writing the formula used, where marks are given for showing methodology. -so student may get a mark as if they had written down the formula used, IF it is very clear from their additional steps towards the answer, and the correct answer that they did use the formula, even if they didn’t write it down!
so the 90% result gets students that naturally would have got 88 or 89% as well as students that can attain 90% with maybe clumsy marking.
Grace marks, (as in free points) don’t exist, but remarks, re-evaluations, and closer examination of those at boundaries does exist. – it’s not free points, it’s a closer look to make sure that all deserved points are awarded.
for someone who failed hard it’s not worth a second look. it’s a time effort vs. outcome equation. it’s unlikely that a paper may have under marked by 5 points, but there may be a couple of points here or there that were failed to be spotted.
4, Classes are normally setted, by which I mean students are grouped by ability, this means that clever kids are not pulled down by the trouble maker kid interrupting the class, but also shits all over any chance of getting a perfect Gaussian distribution. -e.g you’re more likely to see Gaussian distribution within set boundaries, than you are over an entire population, BUT because of differences in teaching at a national level, (in a country with hundreds of millions of people) this isn’t likely to be well defined as a Gaussian curve that may be seen at an individual class or school level. BUT given that different setts may sit different papers, this does make jumps at certain points more likely.
Frankly, if he thinks that this is “unfair” then wait until he hears about positive discrimination, and how someone with lower marks can and will attain a university place even with lower marks because it’s believed that if the “inner city” kid had the more stable environment of the “countryside kid” that they would have achieved higher marks and should be treated as such. -I’ve seen this happening whilst I was working in a university. (which shall remain nameless) I’ve seen kids with two A’s and a B get onto a course requiring three A’s because they live in a rough area or because they get a glowing letter from their head teacher etc.
It’s not unfair. it doesn’t show grade tampering, it shows humanity.
The way he throws around the word impossible so much it’s patently clear he doesn’t understand the difference between unlikely, improbable and impossible.
what if a university finds his blog post they use this information about how much he grasps the concept of statistical analysis to affect whether they would admit him. because that would be “fair” right?
Apparently it’s not “fair” for a teacher to see good work all the time and mark students well, Apparently it’s “Fair” to judge the rest of a persons life and worth based on a result of an exam that happened on a single day regardless of the health and mood of the person on that day? so it should be equally “fair” that his work gone into creating this post should be used as a better indication of his grasp on statistical analysis than his exam results might show?
If you look at the graps, they do not show a nice Gaussian distribution, they show 2 rough Gaussian distributions centred around
Higher achievers, where the distribution starts a 60 – 80% (depending on the graph) and extends to 100.
lower achievers, where the graphs extend from 40ish – 60 -80% ish.
lowest achievers, 0 – 50% highest results seen around 30%.
the mark that impresses me the most is whoever got 2 in IT. you have to try really hard to only get 2, especially in a subject where it’s half teacher marked (which also craps all over the theory that teachers are awarding 50% for free, much more likely that the teachers are awarding fair, and people are scoring on the exam fair, E.g. people score 60% via a 30% teacher awarded course mark and a 30% exam mark.)
All in all, an extraordinarily poor statistical analysis. of course if I had as poor of a grasp of the subject that I claimed to be my best, I’d want to uncover some huge conspiracy too.
http://qph.is.quoracdn.net/main-qimg-8a182c10433d133cc9b2906eed137b49
I think this graph talks for it self, the grades from 0 to 20 were not tempered, you can see all the grades were possible in the other hand from 20 to 40 students were clearly benefited from there on i guess they rounded all the grades to the bigger integer
go find us some speed limit data from state websites please. -Wikispeedia.org
His raw data is the result of modulation (questions give certain amounts of points), therefore his results are modulated as well.
Well, if I was an education ministry that was going to tamper with exam results, I might realize that different schools/subjects need to produce a certain number of graduates to meet demand, and move a few numbers around to maximize the probability of meeting that demand.
In other words, if a certain group of schools needed to produce a certain number of graduates in a certain industry, I’d fudge the marks to make sure the classes get filled, especially in less desirable schools (in other words, having more students that barely pass).
If we look at the median missing value (thank you MRE), it comes out to be 65 (lower than the mean of all fields minus science). Looking at the data distributions, this suggests that more modification is done at the bottom than the top (which makes sense), but may also explain the occasional need to bump certain less-low scores up (note especially the science distribution). As others have stated, the nature of score rounding may actually play the larger role!
If we look at it in this way, we could say that there may exist some policy to encourage the “right” number of people to enter different fields of industry.
Obviously this is amusing speculation and not a rigorous analysis. Also I haven’t slept in 2 days.
Unless the It administrator “states” on the server that “no unauthorized access is permitted” then the IT administrator himself is liable for any activity done on the server.
Are you a lawyer specializing in Indian internet law?
lolz
not to downplay his achievement or anything buuut…
looks like he was the LAST one to figure this out… lol
im guessing every student in the computer sciences courses
caught *_NOT_* “interacting” with their own scores
will be dubbed “not smart enough”
glad this guy made(modified) the grade!
pun intended.
PS: being on a site called Hack.A.Day. you’d think people would
understand the meaning of the word (before using it)
there is illegal “unauthorized access”
and there is hacking.
the two often are used together as in
“hacked the company to get data”
but in this case he did NOT hack the software!
hacking means to use the software in a way it was either
a) not designed to
or
b) designed specifically NOT to
HE USED SOFTWARE EXACTLY AS IT WAS SUPOSED TO FUNCTION
(with the correct url, it gives up the goods, worked perfectly)
he did NOT modify the software to bypass (or add) something.
he made his OWN software(code/script/ect)
but he was still accessing a computer system(s)
WITHOUT being allowed to do so.
PPS: writing a software/code/script/webpage
is NOT hacking, it is programming.
the ONLY time you can use the word “hack”
to describe programming is if you were to
copy and paste different modules together
as in “to hack together a solution”
those modules might be your own, or not.
Hello everyone, I have tried cyberhackez @ gmail. com and i have confirmed their good work among all other hackers out there , they helped me hack into my school website and change my school grades without any trace, he also do all sort of hacks, facebook, whataspp, location tracking of cheating spouse. It was really a big surprise to me but am glad I gave it a try, they will also help you to hack and change your university grades that easy. Contact them for similar issues, cyberhackez @ gmail. com and consider your big problem solved.
Let’s be real – sometimes we need a little expert advice to navigate the treacherous academic waters. Daniel Meuli Web Recovery understands this and provides you with access to knowledgeable mentors and a treasure trove of educational resources. Whether you need help with specific concepts, guidance on effective study techniques, or simply a pep talk to boost your motivation, Daniel Meuli Web Recovery has got your back. Consider it your own personal support system, helping you regain your grade with a touch of magical expertise. Once you know where to focus, it’s time to devise a strategy for success. Daniel Meuli Web Recovery takes the guesswork out of planning by creating personalized study plans tailored to your needs. These study plans are like roadmaps to academic triumph, guiding you through the necessary steps, resources, and timelines to regain your grade. It’s like having your GPS, but instead of “recalculating,” it says “recalibrating your path to success. To embark on your academic recovery journey with Daniel Meuli Web Recovery, the first step is to create an account and set up your profile. It’s like enrolling in a magical academy but without the pesky owls and flying broomsticks. Follow the intuitive sign-up process, provide some basic information, and voila! You’re ready to dive into the world of academic rejuvenation. Email Daniel Meuli web recovery on DANIELMEULIWEBRECOVERY (@) EMAIL. COM OR TELEGRAM (@) DANIELMEULI