Just when you thought you’d seen an Arduino do everything, [birdyberth] built an Arduino powered Electrocardiogram (ECG or EKG). Electrocardiography is a non invasive method of studying the heart. For many of us that means a 10 minute test during our yearly physical exam. Medical grade ECGs can use up to 10 electrodes. To keep things simple [birdyberth] went the route of a few circuits we’ve seen before, and reduced it to two electrodes and a ground reference. [birdyberth] makes note that the circuit is only safe if battery power is used.
The “heart” of any ECG is an instrumentation amplifier. Instrumentation amplifiers can be thought of as super differential amplifiers. They have buffered inputs, low DC offset, low drift, low noise, high open loop gain, and high impedance among other favorable characteristics. The downside is cost. A typical op amp might cost 0.50 USD in single piece quantities. Instrumentation amplifiers, like [birdyberth’s] INA128 can cost $8.30 or (much) more each. The extra cost is understandable when one thinks about the signals being measured. The ECG is “picking up” the heart’s electrical signals from the outside on skin. On commonly used ECG graph paper, a 1mm square translates to about .1 mV. High gain and clean signals are really needed to get any meaningful data here.
Electrodes are another important part of an ECG. Medical grade ECG units typically use disposable adhesive electrodes that make a strong electrical connection to the skin, and hurt like heck when they’re ripped off by the nurse. [birdyberth] was able to make electrodes using nothing more than tin foil and paper clips. We think the real trick is in the shower gel he used to make an electrical connection to his skin. While messy, the gel provides a low resistance path for the tiny currents to flow.
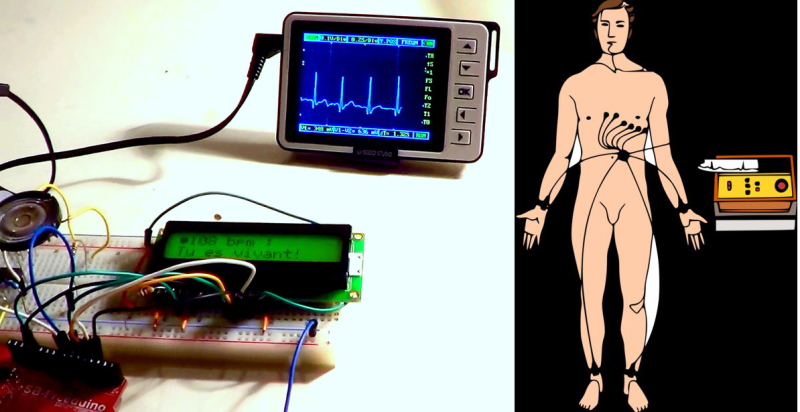
The actual processing in [birdyberth’s] circuit is easy to follow. The signal from the instrumentation amplifier is sent through a low pass filter, through a 741 op amp, and then on to the Arduino. The Arduino uses a 16×2 LCD to display heart rate in beats per minute, along with a friendly message informing you if you are alive or dead. The circuit even provides audible feedback for heart beats, and the classic “flatline tone” when the users either disconnects the electrodes or expires. [birdyberth] has also plugged in his pocket oscilloscope just after the low pass filter. As his video shows, the familiar ECG waveform is clearly visible. We’d love to see a more complex version of this hack combined with [Addie’s] heart simulator, so we could know exactly which heart malady is killing us in real time!


+1
COOL
During the dry months, my biking HRM tends to be erratic, so I use electrode gel. It is cheap and probably more effective than shower gel (and easier to clean up!). http://www.amazon.com/Spectra-Electrode-Parker-Labs-250GM/dp/B0002CA8RQ
I recently observed ECG heart monitors in the hallway of the local hospital’s heart care ward. They had LCD panels with realtime ECG summaries of each patient on the floor. 10 or 12 patients on a screen, dual monitors. It was fascinating to see how they all significantly differed. And they all pretty much look really messed up compared to a normal heart. That’s even obvious to untrained eyes. I suppose that’s what you expect with people admitted on a heart ward.
The ECG hardware would also keep simple statistics about certain events that could be detected, like number of PVCs.
I would have loved to ask a cardiologist about some of the particulars I saw. But ya know, they’re busy saving lives and playing golf.
And keeping patient data private :P
Yes, I had considered that the conversation would be really awkward.
“Wtf is up with the patient in room 312’s heart? That looks really messed up! And 306, is that what a pacemaker looks like?”
It raises tough privacy questions. And yet the benefits to the patients are probably pretty significant and outweight those concerns.
But yeah, the amount that can be discerned from nothing more than external electrodes on the chest is just fascinating. I was at an estate sale a little over a year ago and acquired a bunch of electronic prototypes, mostly on perf board. Some neat stuff, mostly useless. Among them were a couple of things that looked like battery operated defibulators. I made a joke about it at the time, but as I looked more closely, that is exactly what they were (I also found some notes about similar projects in a room that contained hundreds of notebooks, I think he was mostly working on those in the 60’s). Exposed PCB’s, wires, and all. I’m thinking they will go into a ‘break class in case of heart emergency’ case.
It was a great estate sale of a prolific inventor physicist. It made me sad that a lot of his work was going to be tossed.
There is plenty of anonymized ECG data waiting for you to play around with it…
Say here (but I am sure there’s more): http://www.physionet.org/physiobank/database/ptbdb/
One reason why they look so different is that they are on a heart monitor, not on an ECG machine. The idea is just to monitor, not get a clinically diagnostic data. It’s important to know if their heart rate changes, they get arrhythmia or something else.
The wiring is a simple three wire thing (like in this system) and works for this requirement.
I created a more diagnostically usable circuit with full limb connections and six graphs with Arduino and a PC software. Doesn’t use the great instrumentation amps, but is quite usable. Or was, since I started to make it better, something else came up and now I don’t remember where I left off…
Creepy! …afraid of this project — I’m getting older and I know it already! This would make me a complete hypochondriac.
Interesting electronics excercise…. but I highly advise against constructing one unless you have the education to interpret the output. This falls into the category of excellent electronics for the hobbiest but with a caveat that most don’t really know what to do with it other than scare the bejesus outta themselves and disturb the local ER twice a week. Many CBET’s don’t know enough about this one to tell what the results mean, we leave that to the docs. And Lord help ya if ya got Situs inversus!
If you are a smoker though, go construct a pulse oximeter. It’ll show you something that you can easily see and reproduce and do something about to extend your life.
Yeah – well here’s a little primer – the points on the waveform are labeled Q, R, S, T.
They represent different parts of the heart pumping. The smaller waves are the right side of the heart – it’s because in essence the right side does fluid exchange with the pulmonary system. And since it’s essentially blood vessels that run really close the surfaces in the lung, the right side is a low pressure system. Hence the smaller spike in the complex of QRST.
Oh yeah, and that big old spike – that’s the left ventricle firing off.
?? and P?
Incorrect. They represent different stages (atrium/chamber firing/repolarization etc). depending on the wiring different ECG curves show different parts of the heart.
This simple system doesn’t really show much diagnostic data, so it must not be used to diagnose anything.
The P wave is atriums firing and is the first little bump. Isn’t always even visible in all connections. QRS complex is the chambers (most signal is from the left chamber, that’s true, but not only) and then there’s the repolarization phase.
Or, I don’t know, learn how to read the output.
There are plenty of books and on-line resources that tell you and teach you these things.
With a month or two of study you can reasonably proficiently read an ECG machine to diagnose real conditions.
-the real question is whether a home made machine has a good enough read of data to actually tell you what’s going on properly! e.g is waveform seen actually because there is a condition or because a sensor is loose, incorrectly biased, in the wrong place etc.
KY with table salt mixed in works pretty good to make an ion saturated gel that conducts plenty well enough. .
Guess it might be handy to hook up your epitaph message to Facebook, just to keep your loved ones informed?
“You are dead. If symptom persists, consult your doctor.”
I’ve made an expedient electrode gel from water, salt, and cornstarch; heat until it thickens.
“Medical grade ECGs can use up to 10 electrodes.”
Not true. 12 is the hospital and ICU standard. But virtually any number of electrodes above 2 can be used. I’ve read journal articles about 80 lead ECGs for very detailed analysis on AMI progression.
V1 through V6 and the 4 limb leads equals 10. Where are 12 standard? They do produce 12 strips though since the limb leads get recombined into different vectors.
Yup – around here the hospitals use 18 lead. In fact I noticed new rescue trucks with “Advanced Life Support” tags on them. I found out it’s because those trucks carry 18 lead ECG’s. So at the hospital there’s no delay in changeover time – just unplug from the rigs ECG and into the hospitals ECG. Little loss of monitoring that way.
yeah, they call them 12 leads because of the output (i, II, III, avr, avf, avl v1 v2 v3 v4 v5 v6) even though there are only ten inputs.
and 18 leads have 18 views but have V7, 8, and 9 electrodes on the back (producing views (i, II, III, avr, avf, avl v1 v2 v3 v4 v5 v6, v7, v8, v9, v3r v4r v5r) but only 13 electrodes…
(I can’t speak for ALL ambulances everywhere but in the UK at least where I live the machines all have detachable leads, the entire connector unplugs to swap between 5 and 12 lead readouts) so I guess you could transport a patient with all leads still attached.
Great project! The INA series of amplifiers are excellent for this sort of stuff, if a little bit pricey. I’ve used them for thermocouples, strain gauges etc. before. Some (INA125) even have a builtin precision voltage reference, which makes driving bridges really easy).
“V1 through V6 and the 4 limb leads equals 10. Where are 12 standard? They do produce 12 strips though since the limb leads get recombined into different vectors.”
Yes there are only 10 physical electrodes, but 12 measurements are taken. This is due to the fact the Leads 1, 2, and 3 form a triangle. Right hand to left hand, right hand to left foot, and left hand to left foot. A neutral lead is placed on the right foot, and 6 prechordial leads are placed around the sternum. Making for 10 electrodes, but 12 leads of measurement. Each lead giving a different “view” of the heart.
Leads I, II, and III are direct reads from electrodes 1, 2, and 3.
aVR, aVF, and aVL are read as resultants from combinations of leads 1, 2, and 3 , in the the negative electrode is half way between two other electrodes.
While in nursing school I was “the guy” watching all those hearts! The stories I could tell but HIPAA gets in the way.
BTW I am a RN with ACLS certification.
For $5 a pair, these might be worth looking into for your project as well: https://www.sparkfun.com/products/10513 Great build though!
It’s fun to see how much costs have dropped for this type of project since Steve Ciarcia’s build from the (late?) 1970s – if you google “Steve Ciarcia ECG” you’ll find a google books link to the book form (1981) of the Byte magazine article, which was likely from somewhere in the late 1970s (Ciarcia’s Circuit Cellar, Volume 2, Page 74). His was for biofeedback purposes mainly (classic 70s thing to do!) – and his software was written in BASIC. If you care about electronics “hacking” history, you owe it to yourself to check out all of Steve’s old Circuit Cellar articles (or the bound book collection); I’m pretty sure all have been scanned and available on Google Books and/or archive.org – there are probably more than a few other projects waiting in there to be re-imagined using modern parts and design…
How about make an EEG monitor?
This Arduino ECG has Bluetooth and displays the signal on an Android phone:
http://youtu.be/sH5oDiuCh5w