If you do any electronics work–especially digital signal processing–you probably know that any signal can be decomposed into a bunch of sine waves. Conversely, you can generate any signal by adding up a bunch of sine waves. For example, consider a square wave. A square wave of frequency F can be made with a sine wave of frequency F along with all of its odd harmonics (that is, 3F, 5F, 7F, etc.). Of course, to get a perfect square wave, you need an infinite number of odd harmonics, but in practice only a few will do the job.
Like a lot of abstract concepts, it is easy to understand the basic premise and you could look up any of the mathematical algorithms that can take a signal and perform a Fourier transform on it. But can you visualize why the transform works the way it does? If you can’t (or even if you can), you should check out [Mehmet’s] MATLAB visualization of harmonic circles. If you don’t have MATLAB yourself, you can always check out the video (see below).
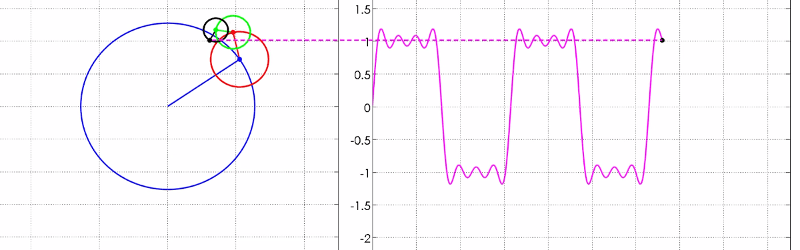
The first part of the video makes the point (visually) that a sine wave is really just a point on a rotating circle moving through time. The second part shows how those circles moving together describe a square wave with ripple. If you haven’t been able to visualize a sum of sine waves, the video will be a real eye-opener.
We’ve talked about a similar (but much older) video a few years back, but the state of animation has apparently advanced a bit since then. You might also enjoy [Bill Herd’s] take on sine and square waves.


“Visualizing Fourier Series” would much better describe this.
Yep, that’s what the video title says
The page title is “VISUALIZING THE FOURIER TRANSFORM”
every time i hear about fourier transform i remember how the greeks solved their problem with astronomy:
they assumed that celestial bodies move around in circle, but they had this empirical problem where the speed seemed to vary a bit around an orbit, and the body seemed to be sometimes further away and sometimes closer, so they added another circle on top of their first circle
https://en.wikipedia.org/wiki/Deferent_and_epicycle
little did they know that adding enough circles with certain revolutions they could describe ANY cyclic motion, not just the ellyptical one…
Thanks for the info
And thus the Spirograph was born. (https://en.wikipedia.org/wiki/Spirograph)
Yep. You can even draw a perfect triangle or square: see Figures 7 & 8 of “The Mathematical Power of Epicyclical Astronomy” (PDF)
http://www.u.arizona.edu/~aversa/scholastic/Mathematical%20Power%20of%20Epicyclical%20Astronomy%20%28Hanson%29.pdf
Square orbit = square wave
Thanks for the link the paper by Hanson … this is indeed an amazing paper.
There is something beautiful about this.
This is a lot easier to understand Fourier Transform visualising it this way than reading complex Math equation.
+1million
Love this
This is really great. I need a similar visualization to help me really understand the Laplace transform – I can memorize it and use it easily enough, but haven’t been able to “visualize” how it really works.
Well if you stick to the imaginary axis, the Laplace transform IS the Fourier transform. So in many ways the Laplace transform is an extension of the Fourier transform to cover all solutions of the form e^((a + ib)*x).
Now do this with a chaos pendulum.
This brings back memories of my Master’s project in 1977. A box with two rows of 10 knobs – amplitude and phase for a fundamental and 9 harmonics. The 6502 (hand assembled with the aid of a Kim-1) read the knobs and used a dac to output the calculated waveform. Pretty trivial today, but challenging back in 1977.
This replaced a Singer (yes, that Singer) machine that was all mechanical (10 cams, magnets and coils)!
Changing the phase on the 3rd harmonic of a square wave is very instructive.
The human ear doesn’t detect this sort of thing well. Hammond used this in their digital waveform storage (early 1980’s ?) to keep the peak signal smaller so the amp didn’t clip.
Didn’t knew that, thanks!
Do you know any good reading about it, please?
Whoa… That’s awesome! Where was this back when i was struggling with Intro to AC Theory? Absolutely fantastic!
Quick question for you signal processing folks.
A square wave is (F + 3F + 5F + 7F + …)
If you then add to it a square wave beginning at 3F but inverted:
(F + 3F + 5F + 7F …) – (3F + 5F + 7F …)
It seems you would just get F, a sine wave at the fundamental? That doesn’t seem right to me: Indeed I just tried it in Audacity and here’s the result.
http://i.imgur.com/JEhuq9P.png
That’s not a sine wave…
That’s not anything. Your PNG was borked.
That’s weird. Try this?
http://imgur.com/JEhuq9P
Just look at the wave forms at each pulse. When they are equal and opposite, they cancel. You can just look at it as adding two DC components at discrete points in time. A good illustration would be to filter the signal at the harmonic frequencies and observe the change.
You’re on the right track, but your second wave isn’t a square wave. In a square wave the 2nd term is 3x the 1st term, your second wave doesn’t have that feature.
If you take a square wave and put it through a low-pass filter it will do what you want – become a sine wave. Something with a cutoff at 2F will let the F term pass through and suppress all the higher terms.
If you want to do this you need a very stiff filter, since a simple filter’s attenuation falls off slowly with frequency. One way is to have several filters with a 3db frequency at, for example, 3F. Each filter reduces the amplitude of the 3F term by a factor of 2, cascade four or five filters together and you get close to a perfect sine.
Curiously, the actual squarewave formula has a 4/PI term in front of it, which means that if you suppress all the higher frequencies, the resulting sine is higher than the original squarewave. (By a factor of 4/PI).
I do this with my ultrasonic entry in the prize – generate a square wave ultrasonic signal, then filter out the higher harmonics for a more-or-less single-frequency output.
Oh right. The equation I put is incorrect, which is why it doesn’t work. The first wave is right (F + 3F + 5F + 7F), but the second wave “a square with fundamental at 3F” would actually be expressed as (3(F) + 3(3F) + 5(3F) + 7(3F)…).
Durr.
Here it is on Wolfram, which shows how one might subtract the red wave from the blue wave and attain a sin wave : )
http://www.wolframalpha.com/input/?i=plot+sin%28x%29+%2B+sin%283x%29%2F3+%2B+sin%285x%29%2F5+%2B+sin%287x%29%2F7+%2B+sin%289x%29%2F9+%2B+sin%2811x%29%2F11+%2B+sin%2813x%29%2F13%2C+sin%283x%29%2F3+%2B+sin%285x%29%2F5+%2B+sin%287x%29%2F7+%2B+sin%289x%29%2F9+%2B+sin%2811x%29%2F11+%2B+sin%2813x%29%2F13
3F + 5F + 7F + …
isn’t a square wave.
You can’t write this article without bringing up this video — Homer Simpson from an FFT:
https://youtu.be/QVuU2YCwHjw?t=1m
No formula? Frustrating!
Came to the comments to post this – you beat me to it :)
Time for me to play the moron that I truly am: In simple terms, how can a perfect square wave (assuming this is possible) be anything more than full on/full off or full high/full low? I’ve always accepted that square waves could be broken down into their component sine waves and harmonics, but I’ve never understood WHY. Please keep in mind that not everyone has a masters level engineering degree.
Not a dumb question – your intuition is right that you CANNOT get a ‘perfect’ square wave by adding sine waves. What you can get is a really really close approximation of a square wave, that looks like it goes straight from HIGH to LOW.
Simple terms: There’s no such thing as a perfect square wave, just like there’s no such thing as teleportation. ;)
In order for a square wave to be composed of sine waves, would not those sine waves occurring at either end have to have an infinite frequency?
This is similar to describing the motion of an object in “frozen frames” of action of duration 0 time.
A good question.
You’ll need an infinite set of sine waves to get a “perfect” square wave.
Looking at it a different way – if you low pass filter (with a perfect filter) a square wave you get the ringing waveform that is what the finite set of summed sine waves create. Look up Gibbs phenomenon on wiki.
Have a look at this spreadsheet: https://docs.google.com/a/hackaday.com/spreadsheets/d/1i04yYcMvlni1bAJCYczLRglFb61LFtm8vf_FeGut47s/edit?usp=sharing
Note that the 3F component is 1/3 the main, the 5F component is 1/5 etc.
See how fast it gets “kind of square”? And the further you go, the squarer it gets. But it never gets totally square.
Sorry just realized I didn’t have sharing set up right. If you didn’t get in, try again!
As others have mentioned, you’re not going to get a perfect square wave in reality (have to be realistic and all). However, in a more abstract sense, mathematically, you can describe a ‘perfect’ square wave (or rather, any reasonably well behaved periodic function between two set endpoints -which may require rescaling, but that’s a minor issue-) in terms of a Fourier series; you just need an infinite number of terms in that series, which is where reality gets to bite you.
The reasoning behind this, is that a Fourier series defines a complete basis for the ‘funciton space’ (basically, any function that happens to fit the definition above) of interest, and you can write any member of this space in terms of a linear superposition of functions definined from your Fourier series. There’s lots that can be said about this, with more mathematical details and more than I’d want to type (or could type) in a comment box, but here’s a link of something that gives a bit more detail (I’m sure you could google more and/or better, but I just did a quick search, and it seemed relatively decent). http://web.mit.edu/18.06/www/Fall07/operators.pdf
Again, of course, you’re not going to get a perfect square wave with a finite number of Fourier terms in your series (in essence, it’s then not a complete basis, and can’t describe all the functions with definition above); reality bites. Then again, in reality, for any series, you can oftentimes get away with taking the series out to a point where it’s ‘good enough’ and call it done, and the square wave isn’t an exception to this.
As you add more terms, the approximation gets closer and closer. As I recall, the maximum amplitude overshoot actually doesn’t converge to the square wave — it remains roughly the same, but the width of the overshoot pulse, and thus the energy, approaches zero.
I couldn’t recall the name for it, but google fixed that for me on the first search try:
http://www.thefullwiki.org/Gibbs_phenomenon
Meanwhile, no Matlab required:
http://toxicdump.org/stuff/FourierToy.swf
Also, everyone go watch The Engineer Guy videos on the Michelson mechanical Fourier calculator.
Word!
http://hackaday.com/2014/11/18/harmonic-analyzer-mechanical-fourier-computer/
Mesmerizing! Cheers!
If you like these sorts of visualisations have a look at this intro to DSP by Jack Schaedler:
https://jackschaedler.github.io/circles-sines-signals/
For even more eye candy. The D3.js library and API has well TOO MANY EXAMPLES.
Javascript and WebGL required.
http://christopheviau.com/d3list/gallery.html
You can find an absurd amount of “D3.org math function visualization examples galleries”. I admit I have a hard time sifting through all of them but they are awesome never the less.
I first saw this as a tweet in GIF format:
https://twitter.com/Vector_GL/status/612337298064150529
Fun to watch!
I’ve seen this before
https://www.youtube.com/watch?t=79&v=SpzNQOOBeRg
Similar to the wave generated by a clarinet due to harmonics:
[youtube http://www.youtube.com/watch?v=PgqEaUT8Qo0&w=420&h=315%5D
Sorry it is 44:40 minutes in.
There was a website I stumbled upon years ago with identical animations, except they were all animated GIFs and not a video so you could stare at the tracings as long as you liked. Wish I could find it again…
For those interested, I have similar animations and other visualizations on my webpage http://HilbertSpectrum.com
This is really cool!
I didn’t understand one thing though. It seems like, if he had arranged the very same circles in a different order, he would have ended up with a different wave. However, when simply adding waves, the order should not really matter. How does he know how to order the circles in order to get the right wave?
Order does not matter because the associative property holds for complex number i.e., a + b + c = c + a + b.
On the other hand the initial phase angles of the vectors relative to one another does in fact make a difference.
Correct. That was not the point that got me confused though.
I get the impression that, if he had stacked those circles up differently, he would’ve ended up with a different wave. The math tells me this should not be the case because we all know the order should not matter. However, when I look at the visualization, I get the impression the order at which he stacked the circles up makes a difference. Am I simply wrong about that? Would he have gotten the same wave no matter how he stacked those circles up?
Addition in the complex plane is equivalent to placing vectors end to end. Changing the order of the summation is equivalent to changing the order that the circles are stacked. If the order was changed, the animation would look quite different but the location of the end point would remain the same (due to the associative property). Thus, regardless of the order, the same waveform would result from the superposition.
I agree with Steven on this note. I created the above animation and if you play with the code and stack them in different orders, the end point will exactly be same but the left hand side would not be looking same.
no such thing as enjoyx should etc about it, ts just a toolx, nonex
Thanks for the beautiful video.