A gravimeter, as the name suggests, measures gravity. These specialized accelerometers can find underground resources and measure volcanic activity. Unfortunately, traditional instruments are relatively large and expensive (nearly 20 pounds and $100,000). Of course, MEMS accelerometers are old hat, but none of them have been stable enough to be called gravimeters. Until now.
In a recent edition of Nature (pdf), researchers at the University of Glasgow have built a MEMS device that has the stability to work as a gravimeter. To demonstrate this, they used it to measure the tides over six days.
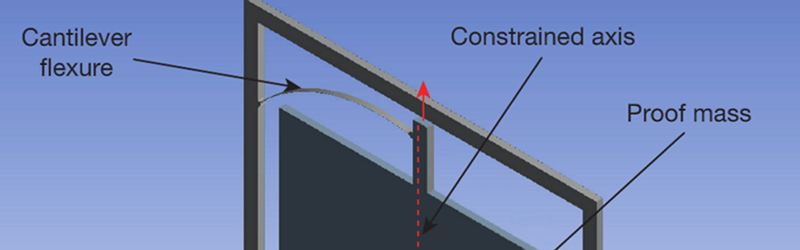
The device functions as a relative gravimeter. Essentially a tiny weight hangs from a tiny spring, and the device measures the pull of gravity on the spring. The design of the Glasgow device has a low resonate frequency (2.3 Hz).
Small and inexpensive devices could monitor volcanoes or fly on drones to find tunnels or buried oil and gas (a job currently done by low altitude aircraft). We’ve covered MEMS accelerometers before, although not at this stability level. We’ve even seen an explanation from the Engineer Guy.


now we just need a way of ordering
For my team’s hackaday prize entry (lasercut optics bench), one of the proposed experiments is measuring the pull of gravity. We figure it’s possible to sense the pull of the moon with a simple optical setup.
(And our .io page is totally blank ATM because we’ve just got started, and I’m composing the 1st build log now.)
I remember (I think it was) an Amateur Scientist article that had a weight hanging from a spring with a magnet on one side. A coil would pull the magnet up or down, and a beam of light bounced off of a mirror on the weight leading to a pair of phototransistors in opposition.
The DC current on the coil moved the magnet to keep the light centered between the two sensors, and the system recorded the voltage needed to do that.
Over time, a signal from the attraction of the moon was clearly evident.
I recall seeing that one too
As a followup, assume a 1KG weight:
(Gravitational Constant) * 7.34767309 * 10^22 kilograms * 1 kilogram / ((370300000 * 1 meter)^2)= 3.576×10^-5 kg m/s^2 (kilogram meters per second squared)
=^= 36 micro newtons
Assume the weight hangs from a rubber band, with a spring constant of 88 N/M
Displacement due to moon is 409 nM, or about 1 wavelength of blue light.
Easily detected with a laser interferometer, which is easy to set up. I’ve actually done this (set up an interferometer) on my kitchen table.
Twice the mass makes twice the displacement, a ballpoint pen (spring constant: 221 N/M) about 1/3 the displacement.
The weight is also pulled up when the moon is on the opposite side of the planet – the moon does *not* pull the weight down when it’s directly underneath our feet.
Can you explain why?
Moon – Earth system is like a carousel. There is a gravity force and centrifugal force. If you are nearer the Moon, the Moon gravity is bigger and you are lighter. If you are on the opposite site, the centrifugal force is bigger and you are lighter too.
Sorry for my bad English.
The moon pulls the instrument directly towards itself, and the moon pulls the center of the earth directly towards itself. The sun pulls the instrument directly towards itself, and the sun pulls the center of the earth directly towards itself.
You have to calculate four sets of three values. You need the GM values for the sun and moon, the location of the center of the earth, the location of the instrument on the earth, the location of the moon, and the location of the sun – for the time of each measurement.
g(sun, instrument) = GMs/(Rsi)^2 pointing from the instrument towards the sun
g(sun, earthcenter) = GMs/(Rse)^2 pointing from the center of the earth towards the sun
deltag(sun, instrument) = [g(sun, instrument) – g(sun, earthcenter)] * [unit vector pointing from the station to the sun).
g(moon, instrument) = GMs/(Rsi)^2 pointing from the instrument towards the moon
g(moon, earthcenter) = GMs/(Rse)^2 pointing from the center of the earth towards the moon
deltag(moon, instrument) = [g(moon, instrument) – g(moon, earthcenter)] * [unit vector pointing from the station to the moon).
TidalAcceleration(instrument) = deltag(sun, instrument) + deltag(moon, instrument) where you add the two deltag vectors.
It is simple, and fairly easy to remember. It gives good results and is useful for routine calibrations. As I show in the example below, it fits the data nicely. If someone knows a better way, without having to rely on a complex model of the earth and its many gyrations and vibrations, I would like to know. With the three axis gravimeters it fits all three axes of the signal well. With simple vector geometry, Newtonian formulas, and a friendly and reliable Jet Propulsion Lab online empheris for the precise positions of the sun, moon and earth in station coordinates for given measurement time, in a convenient form.
But how would you strap such a sensitive device to a drone without swamping the data with vibrations and drone movements?
They can use drone to move the gravimetr a and measure after landing.
You mount the gravimeter on its own stabilized platform, and subtract off the motion caused by the aircraft, measured independently from LiDAR and/or GPS. It’s been a solved problem form more than a decade.
It would take some doing to cram that in something less than Robinson R22, but I’d guess it would be possible these days.
If it fits on an R22 then it should fit on a C-172 or PA-28-180 with no problem and cost a lot less per hour.
True. I suggested a R22 because the previous commenter wants to drone-mount it, and the R22 is the least expensive rotorcraft I know of (except maybe a Bell 47). It’s maybe a third the operating cost of the more usual Bell 206, for example (we used to pay $6/minute all-in for a 206+jockey, which probably says more about how long it’s been since I was flying…). But you’re right, a 172 is a better platform and less than half the operating cost of even the R22. I have no experience with Pipers, but it’s probably similar.
The Nature abstract and the summary here neglect to mention that the accelerometer, to function to the precision needed, must be in high vacuum and temperature controlled to within 1 milliKelvin. Do-able, but it’s not quite as simple as just a thin slab of silicon.
High Vacuum is not to hard to do on die , it won’t be penny/chip cheap but is common enough for high Q MEMS stuff. Regulating temp to a mK is bog standard for precision equipment like voltage and timing references. Not the lowest power, but something doable for a few bucks and a few watts.
Yeah, I’m thinking something like OCXO complexity/cost.
I am looking for 25 small inexpensive gravimeters as monitoring devices. Please send more info such as cost and size of unit. Thanks. Terry
Anyone playing around with this I would be interested in noting the exact UTC of the observed gravitational meridian passage of the sun from a known location
Using the Sun Moon Tidal Gravity Signal to Calibrate New Gravimeter Designs
Using the Sun Moon Tidal Gravity Signal to Calibrate New Gravimeter Designs
I have been using the vector tidal gravity signal from the sun and moon to calibrate superconducting gravimeters and seismometers for the last ten years or so. The problem is the SGs are single axis devices so you cannot invert to track the sun and moon. So, I went through all the seismometer networks to find the instruments that can “see” the sun moon signal. The three axis broadband seismometers work best, but many devices see the signal, Since they are three axis, you can solve for the minimum sum of squares on the regression for each axis to find the best orientation and location for the site. This can be useful if you want to build arrays of gravimeters for imaging, and not worry too much about their placement and orientation.
The signal itself can be calculated second by second from the Jet Propulsion Labs online Horizon system To get started, you can use minute by minute sample generation, and use the extra time to oversample to get your required resolution.
https://ssd.jpl.nasa.gov/horizons.cgi
You need the sun, moon and earth vectors in station coordinates, and you need to specify CSV output, The calculation is very simple, but tedious to handle. You take the Newtonian gravitational acceleration of the sun acting at the station, minus the sun acting at the center of the earth. Then add the moon acting at the station, minus the moon acting on the center of the earth.
The GM values for the sun and moon come with the JPL results.
This vector tidal acceleration directly from the JPL calculations is in earth centered equatorial coordinates. You have to dot the vector into the local Vertical, North and East unit vectors for the station. And you need to use the station coordinates to estimate the local contribution of the centrifugal acceleration. It points radially through the station location outward from the rotation axis in the JPL coordinates. That is added before you dot the local unit vectors.
The signal shape depends on the latidude, the varying distance of the sun, moon and earth. The magnitude is roughly 1500 nanometers per second squared (nm/s2) and that gets projected onto the station’s three axes. The earth based “noise” is the signal for the geophysicists. It is about +/- 50 nm/s2 and contains a wide variety of useful information on atmospheric, ocean, earth and human contributions to the local acceleration field at the instrument. I am trying to develop high sampling rate, three axis gravimeters at very high sensitivity so one can use the time of flight methods for imaging. The seismometer networks, operating in gravimeter/accelerometer mode are reaching the point where they can detect the change in the gravitational potential associated with an earthquake or tsunami as it diffuses at the speed of light or gravity to the detector array. Potentially, using gigasample per second ADCs, one can apply all the electromagnetic time of flight methods to gravitational imaging.
I put an example of using the signal to calibrate a superconducting gravimeter in China in spreadsheet format at http://gravitynotes.org/Files/HsinchuSample.xlsx My rough notes on the new gravimeters and their uses are at GravityNotes.Org.
This approach using JPL ephemeris is good if you are wanting to get started with a basic sun moon tracking system. You need a small array of widely spaced instruments to get better numbers, but with three axis designs, once they are calibrated, you can take the readings as an estimate of the current location of the sun and moon. If you are using high sampling rates or taking random samples in time, you can use the JPL Chebyshev polynomials to calculate the sun moon and earth postions at the sample times. The regression itself is a simple linear regression. For a well oriented site, each axis needs only an offest and multiplier. Six numbers. Even if you have very noisy sensors, if they are sensitive enough, you can use massive oversampling to offset the noise, calibrate to the signal, and then find the errors in your system and make improvements.
I made a video some time ago to explain to someone about using the sun moon signal to calibrate seismometers accelerometers and gravimeters. It can also be applied to ANY instrument or experiment that has to take earth tides into account. The number of technologies and groups reaching this threshold is staggering. Virtually any instrument that has to measure one part in ten million using electrical measurements will have to begin thinking about whether the changing gravitational potential and its gradient (the acceleration field) has to be taken into account.
https://www.youtube.com/watch?v=wB_xwUdf2mw&t=1127s
Good luck. If you get an instrument that can see the signal, and it is stable, I can try to show you how to use this simple first calibration method. I wanted something that was easy enough for a high school student to do. If you get the MEMS gravimeter people to allow you to use their system, you can calibrate even fairly noisy ones this way.
I am looking a hundreds of variations for low cost gravimeters. One is to use noncontact atomic force sensor to track a simple pendulum, or a set of one swinging plates for North and East, and a cantilever for vertical. A one meter pendulum will have a somewhat elliptical orbit in the North East (xy) plane that is about 1 micron in area. You probably can use simple interferometry to measure those two axes, run the calibrations and learn enough to think of something better.
I am a mathematical statistician. My original training is in physics, particularly gravitational physics and geodesy. But I spent my life on global economic, social and technological problems. My interest now is to find a way to lower the high cost of learning, since human time spend searching for things long known and weill understood is hurting society.
Once you calibrate the instrument, you can weigh the sun, by using local masses and seeing the response. You have to hold the moon as known.
Richard Collins, The Internet Foundation
21 Mar 2019
——————————- Using Horizon ————————-
If you want to use the JPL Horizons email interface you can use the following batch file. Run it three times, changing the COMMAND value, sun=10, earth=399, luna=301. The longitude is measured from Greenich with degrees west positive, and from Greenich eastward negative. This is a one minute run that will give 1440 sets of vectors for each day in Feb 2019. I will see if I can post the Javascript program somewhere that I use to read the three files and put the calculated signal into a spreadsheet. Then you use use linear regression to fit your data for the same times. It is OK to have random error in times and measurements. In fact, it is hard to “game” the results since the only thing that can match that signal is the signal itself. :)
!$$SOF
COMMAND= ’10’
CENTER= ‘coord@399’
COORD_TYPE= ‘GEODETIC’
SITE_COORD= ‘14.3803429,46.0660318,0.011’
MAKE_EPHEM= ‘YES’
TABLE_TYPE= ‘VECTORS’
START_TIME= ‘2019-02-01’
STOP_TIME= ‘2019-03-01’
STEP_SIZE= ‘1 m’
OUT_UNITS= ‘KM-S’
REF_PLANE= ‘FRAME’
REF_SYSTEM= ‘J2000’
VECT_CORR= ‘NONE’
VEC_LABELS= ‘YES’
VEC_DELTA_T= ‘NO’
CSV_FORMAT= ‘YES’
OBJ_DATA= ‘YES’
VEC_TABLE= ‘1’
!$$EOF
In that video I just posted, skip to minute 18 if you want to see the signals. I was explaining this to someone who wanted lots of details.