Things seem to go in cycles. Writing a document using old-fashioned tools like TROFF or LaTeX is like knowing a secret code. Visual editors quickly took over, although even WordStar had some “dot commands” that you put in as text. Then HTML showed up and we were back to coding formatting as text strings.
Fast forward to the present, and HTML’s ubiquity makes that seem normal. Sure, there are visual editors, but it seems perfectly normal now to write <b> for bold text. However, as HTML grows to handle more tasks it also gets more complex. That’s led to the creation of things like Markdown which is just for simple text formatting.
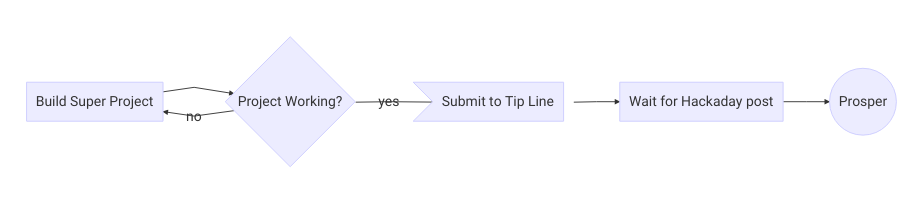
Sometimes pictures and diagrams are critical for documenting complex software and hardware. Sure, there’s plenty of visual ways to do drawings. Mermaid aims to bring simple text markup to your graphical diagram creation. Diagrams like this one:
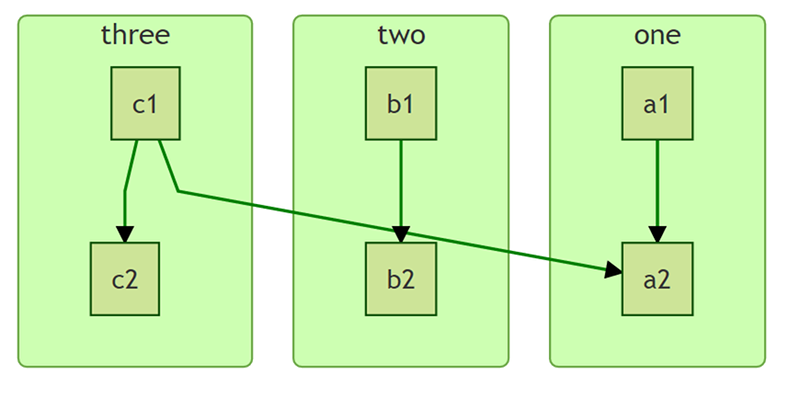
This doesn’t show off all of Mermaid’s capabilities, which it inherits from d3. For example, you can set CSS styles and even allow JavaScript integration to make your diagrams interactive. On the other hand, things like the diamond decision block are difficult to make look right. We couldn’t figure out how to get a line to connect two columns, either.
Inside the Code
Here’s the markup code for that diagram:
graph LR

 id1[Build Super Project]
 id2a{Project Working?}
 id3>Submit to Tip Line]
 id4[Wait for Hackaday post]
 id5((Prosper))
 id1-->id2a
 id2a-->|yes|id3
 id2a-->|no|id1
 id3-->id4
 id4-->id5
About the Code
The “graph LR” line tells Mermaid that the graph goes left to right. The next several lines define all the blocks. You can see that the characters that surround the text give the shape of the node. That is “()” make a rounded box and “(())” makes a circle.
The lines with “–>” in them define the connections between the nodes. You can find a complete reference for the syntax online.
Just Flowcharts?
The system can currently make flow charts, sequence diagrams, and Gantt charts. The documentation is pretty good and you can embed it in a web page. You can also use the online editor live and generate links or SVG files.
There are many ways to get editable markup diagrams into your documentation. For instance, we’ve covered XWave and another timing diagram font where the fonts form the timing diagrams directly. For something more modern, there’s Wavedrom. Mermaid looks like a good complement to these tools, but for flowcharts.
Documentation isn’t always the most fun part of a project. But if you want others to duplicate it, have a record of your accomplishment, and even recall details when you have to fix or augment a system years after you finish it, you need good documentation. Mermaid might be just the tool to help you bang out that good-looking diagram that’s worth a thousand words.


I dunno.
Currently, I keep my own project notes as .txt files, with a sort of Markdown-like format. For anything that is shared… we’re pretty much using Google docs for all that (and also a few wikis). For diagrams, Google Drawing is as fast as anything else I’ve ever used to document a flow, logic diagram, system overview, and it’s ready to be shared, amended, commented upon.
The point of a diagram/flowchart/drawing is to convey something tht can’t as easily be done in just text. I don’t see myself sitting down to write markup to make a diagram, render, swear, redo, render, swear. I would want a graphic GUI that produces the Mermaid markup from my drawing… so that other people would have something to render to a drawing and … what was the point again?
For one thing, it lends itself well to automation. You can take some source data that includes dates, and generate markdown that creates a Gantt chart pretty quickly. GUIs are convenient, but more difficult to automate.
For another, this allows the entire chart to be stored in a database text field.
Those are two benefits off the top of my head.
Good points, and after spending a little more time on their site I can see the point of this for some types of simple diagrams like the interaction chart,,, but a complex flowchart could be misery. Interesting, anyways.
The first line in your code snippet reads “graph TB” as if you were trying to create a top to bottom graph. Left over from your attempt to do that?
Yeah the TB didn’t fit well on the blog page format. Fixed.
Everything which should look nice and follows the unknown (for me at least) rules of typography I use LaTeX. Especially if you do recurring analysis it’s pretty easy to setup a workflow with “make” which calculates creates figures (via matplotlib you can include tags, formulars ,etc) and builds your pdf in one command.
Other stuff CV (in multiple languages in one document) and letters are made easy that way.
Only the fast stuff goes WYSIWYG.
How does this improve over TikZ?
From what I’ve seen, it is trading power and customization for simplicity, which is often a valuable thing. (If I have never used either package and just want a simple flowchart that is easily changed, I’d pick Mermaid every time, as it would save me a lot of time and effort.)
Why did they have to invent their own markup, instead of using the standard dot/graphviz language? :-(
I use graphviz for these sorts of applications too. Fine by me. This one makes it webbier, with embeddable scripts and assorted whizzybangs. If that’s what you need…
I like the Gantt and sequence charts. A lot of it feels like explored territory though.
http://visjs.org/ Another webby graph lib.
https://github.com/mdaines/viz.js The first thing I thought of when I saw a graph and the word javascript.
Sure, they made it more “friendly” and so on, but why didn’t they have to reinvent the language, instead of keeping it all similar and making it easier to learn if you already know one, and to convert?
As a programmer, I’d love to see a tool like this that makes UML Activity Diagrams
What about plantuml.com ?
They exist and aren’t too hard to find. PlantUML (http://plantuml.com) is the only one I can think of at the moment, but there are a number of them. And it’s easy to draw UML with graphviz. In general, I can’t recommend graphviz enough (http://www.graphviz.org/content/resources for examples of related tools).
I agree that sometimes you need WYSIWIG, but the other 99% of the time, I much prefer simple text files and related tools. No doubt that LaTeX and TeX can be difficult and frustrating, but the OP’s characterization of them as old-fashioned is inaccurate, to put it mildly.
ArgoUML is still out there, somewhere.
Plantuml it is ;)
You guys are great! Gonna check out these tools!
I prefer the Eclipse based Papyrus software. I’m surprised it isn’t more popular.
https://eclipse.org/papyrus/
We used it in our courses and it was rather bad experience. PlantUML is much better (to write, store and read) and can be included in makefile for building latex or doxygen documentation
Did they seriously just reinvent Graphviz?
What about Dot/graphviz? It’s a bit obtuse but I’m pretty sure you could get a flow chart to work out very well even if UML is a bit much to try with it. Also Markdown is much more than just a shortcut for HTML, it’s meant to be both formatted plain text and a document language simultaneously. Markdown is meant to fit a use case of formatted document fragments that can be used in multiple contexts: posted into emails and forum posts and the like. It’s got side cases after the fact for things like note taking and other minimalist editing, which is great given the seeming (anecdotally to me) higher percentage of ADD and the like in engineering fields.
ConceptDraw or even Microsoft’s OneNote.
Don’t forget LilyPond:
\version “2.18.0”
%( https://www.youtube.com/watch?v=2mtqujcyXHs %)
\header {
tagline = “Lift Every Voice and Sing”
}
rha = \relative c’ { 8\( 8 8 }
lha = \relative c, { e4.-\markup { \teeny “E in bass for flavor” } }
rhb = \relative c’ { << 4\tieDown >> 8\) }
lhb = \relative c, { ees4. ees4. }
rhc = \relative c’ { 8\( 8 8 4\)
es’8 es’8 r4
}
lhc = \relative c, { 2. }
rhd = \relative c’ { 4-\markup { \teeny “Open voicing” }
2\fermata }
lhd = \relative c, { 4 2\fermata }
rhe = \relative c’ { 8 8 8
4. }
lhe = \relative c, { ees8 f8 g8 4. }
rhf = \relative c’ { 4. 4. }
lhf = \relative c { 4. 4. }
rhg = \relative c’ { 8\( 8 8 4. }
lhg = \relative c, { 4. e4. }
rhh = \relative c’ { 4. 4.\) }
lhh = \relative c, { ees4. f4. }
rhi = \relative c’ { 8 8 8 }
lhi = \relative c, { f8 g8 a8 }
rhj = \relative c’ { 4. }
lhj = \relative c, { bes4. }
rhk = \relative c’ { 8 8 8 }
lhk = \relative c, { 8 8 f8 }
\score {
\new PianoStaff
<>
\layout {}
\midi {}
}
I use https://www.websequencediagrams.com/ for a ton of documentation. I love the very simple syntax it uses. Maybe the authors could look at it as a way to get multiple cols to work.
There’s a trend for literate programming too, albeit a quiet one. Tools like Isabelle have LaTeX support baked in with magic rendering of unicode etc, and the intention of proof being mixed with prose explaining the process.
We have similar things with iPython notebooks, and similar tools for R and F#.
Tools like MathJax and KaTeX make embedded rich LaTeX content into web documents very straightforward and compliment documentation with well presented mathematical artefacts.
The best tools for the job have been there a long time, but now they’re being more tightly integrated.
> but it seems perfectly normal now to write for bold text
Actually the use of this tag is discouraged now, you should use or strong> instead.
Duh, HMTL is not filtered, I meant <em> or <strong>