When working with anything digital, you’re going to end up reading or writing a timing diagram before long. For us, that’s meant keeping (text) notes, drawing something on a napkin, or using a tool like Inkscape. None of these are ideal.
An afternoon’s search for a better tool ended up with Wavedrom.
Just so you know where we’re coming from, here’s our list of desiderata for a timing diagram drawing solution:
- Diagrams have a text-based representation, so their generation can be easily scripted and the results versioned and tracked throughout project development
- Command-line rendering of images, because we like to automate everything
- Looks good
- Simple to use for common cases, but flexible enough to do some strange stuff when needed
- Output modifiable when absolutely necessary: SVG would be nice
Basically, what we want is graphviz for timing diagrams.
Wavedrom nails four out of these five at the moment, and has promise to cover all of the bases. Give the online editor demo a try. We found it intuitive enough that we could make simple diagrams without even reading the fine manual. The tutorial has got you covered for more esoteric use cases.
Clearly, some good thought has been put into the waveform description language, WaveJSON; it’s mostly readable and makes the essentials quick and easy. Because you can also enter straight SVG, it leaves the door open for full-fledged lunacy.
Wavedrom is written in JavaScript, and built for embedding in webpages; that’s the way they intend us to use it. On the other hand, if you want to run your own local version of the online editor, you can download it and install it locally if you’d like.
Our only quibble is that the standalone, command-line application wouldn’t generate images without the GUI on our Arch system. (Looks like there are some Google Chrome dependencies?) Otherwise, we think we’ve found our solution.
There are other applications out there. Drawtiming looks good, but we can’t quite get our head around the file format and the graphic output isn’t as flexible as we’d like: it only outputs GIF and we’re more into SVG because it can be edited easily after the fact.
There are font-based solutions that let you “type” the timing diagrams. We found Xwave and “Timing Diagram Font“. These work but aren’t particularly flexible; if you want something to happen at odd times, you’re out of luck. Plus, it just feels like a dirty hack, as if that were a bad thing.
Latex users can use tikz-timing, which makes sketching out your timing diagrams as much fun as laying out a very complex table in Latex (that is: not fun at all). On the other hand, it looks good, is ultimately flexible, outputs PDF, and would be scriptable if someone put the time in to write a nice frontend.
So for the next little while, we’re trying out Wavedrom.
What do you use for making timing diagrams?


Damnit I could have used this a few weeks ago for my dissertation! Looks very impressive, and with it using a common format such as JSON this means it could be used with other programs as well that need to generate a waveform. Glad to see there is a downloadable version too rather than just web based.
Also I tried searching for something like this before, why are there no other waveform editors out there?
TimingAnalyzer b981.zip, TimingEditor-0.1-src.7z are the two open source packages that I found when I was searching for the demo for Timing Designer last year.
I learned two things from this post:
1. An awesome new tool
2. The word “desiderata!” :)
I looked that word up too. Glad I’m not the only one ;-)
back in the day, we used Timing Designer, very powerful. I think it’s still around – but it’s commercial
Wish I saved a copy when it was a no save demo has no time limit and no registered was required.
It was more than a pretty picture. It has sort of a spreadsheet way of entering relationship, constraint and can handle min, max etc.
About 15 years ago I used the free eval of a tool called “TimingDesigner”
That was a great tool which allowed you to enter the datasheets timings (tpd, thold, tsu, …) so when drawing you could assign some constraints on both outputs and inputs and the diagram would take into account the variations and highlight any timing violations.
I just googled and found a tool by the same name but that cost the price of a small car ;) I don’t know if it is the evolution of the same or a totally new product.
If I have to use a non-GUI script crap for doing timing diagram, I might as well write a test bench in VHDL/Verilog and use Modelsim or whatever the FPGA vendor bundled tool. After all, the test bench is the real living document /timing specs and usable for a simulation and not just a waste of time piece of code that I kept around that needs more work to update as well.
Right on. I used to use GWave alongside the Xilinx IDE. It seems to be a stagnant project since 2009, though.
But what do you do when you want to display / record how the system _should_ be behaving rather than how it _is_ behaving? Like for writing specs. Then you need something else, no?
not really, writing behavioral verilog/VHDL to make the waveforms you want is easier that learning yet another scripting language
Have you tried the online demo?
A timing diagram should be really be able to do the following things:
– a specification of what you want to do or used for checking. Scripts need constant maintenance to keep up to date.
– a way of visualization for the timing relationships/constraints. Scripts/HDL languages fail the interactivity/what-if part in this aspect.
There is only do much time to learn new things, so I would pick VHDL/Verilog path. HDL are all in one standardized specification/implementation/testing languages right from the start why go somewhere else? There are right now 2 main HDL language instead of god know how many NIH (Not Invented Here) scripting language of the month.
I use WaveDrom to render the captured logic waveforms for the web client of BeagleLogic. Take a look at the demo here:
https://www.youtube.com/watch?v=CDbEAq33vdA&feature=youtu.be&t=2m05s
Unfortunately the SVG nature of the rendered graphic causes the browser window to hang up if the number of samples increases beyond 10000. Until I come across something which has better performance, I would be sticking with WaveDrom as it generates really nice timing diagrams.
Very nice approach and work. I have an old Beaglebone A6 that I think just found a new purpose.
Since WaveJSON is being used, analysis of the timing diagrams could also be done. I’m wondering about comparison of measured vs expected.
I can take a look at the performance issues you are having with WaveDrom. Can you file an issue on the Github?
Awesome!
Second that!
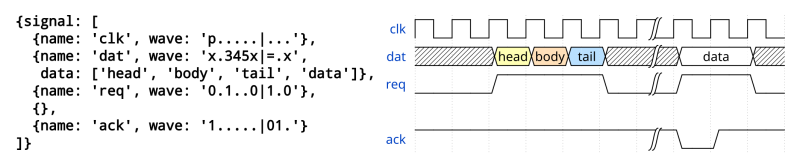
This is too cool. Here’s a high-five awesomeness timing diagram that uses Wavedrom.
https://gist.github.com/dhulihan/a914216c456013ef003a
Hmm in wavedrom I made a simple change to one of the default waveforms and got something that looks incorrect to what I would expect “{name: ‘ack’, wave: ’10….|.01′}” it ends up with a weird little spike feature.
It is intentional. The version without glitch would be: {name: ‘ack’, wave: ’10….|..1′}
HELP!! lol
I really need some sort of timing generator for rending actual diagrams and not graphs like these.
I have complex timings that have static components such as gate delays and I want to be able to alter the core clock frequency without re-writing the whole graph.
I need markers and times (like dimensions) and to show problem areas like this –
Tacc = (1 / 2 * Fclk) + 23nS; // calculate access window start for this clock frequency
if ((Tacc – Tavv) < 5nS) MarkerColor="yellow"; // less than 5nS timing window start
if ((Tacc – Tavv) < 0nS) MarkerColor="#FF0000"); // timing failure – negative access time
A stringy protocol like wavejson can't do this as far as I know, unless variables can be put in the wavejason and be evaluated. I am comfortable using wavejson / javascript if it can do this.
I am happy any scripting language, I prefer curly bracket over dotted for things like this.
WaveJSON is actually evaluated by JavaScript compiler. So you can put an script instead of the data. Here is an example:
https://groups.google.com/d/msg/wavedrom/KIQjAfaNSlk/tMQIlCYxCLQJ
It’s a great tool (I used it to document one of my projects), but my main beef with it is the data transitions don’t quite line up with the grid in the background!
Could you describe an issue in a separate ticket here: https://github.com/drom/wavedrom ?
I use the VCD text format to generate timing traces in simavr, and ‘gtkwave’ to render them. It’s a little bit primitive, and the format is not very compact at all, but it scales reasonably well.
The text format is also very very simple even if it’s more oriented for machine-generated traces. Oh and gtkwave rendering is nowhere as pretty as the wavedrom!
For a cheap and easy way to draw a timing diagram using nothing but a text editor, check out:
http://www.josephpalmer.com/cgi-local/View_Permalink.cgi?entry=2004/6/30/02:31:40:163
Nice one. Thanks for the link.
http://www.josephpalmer.com/history/2004_history.shtml
Go to “xwave – A Waveform Font”
Very neat indeed, nice work drom! The script is logical (no pun intended :)
Looking at the IEC 60617 example, the gates are remarkably similar to those produced by IBM’s Automated Logic Diagrams (ALDs) for their IBM System/360 series mainframe circuit diagrams way back in the mid 60s using AND-OR-INVERT modules, except IBM used a tiny triangle instead of a bubble for the invert. For an example, an SR flipflop on page 28 of http://bitsavers.trailing-edge.com/pdf/ibm/logic/SLT_Circuit_Design_Hbk.pdf
I love retro logic schematic drawings. I hope I will have time to do good schematic layout engine for this.
Wavedrom is nice. I had looked for a long time for a tool like wavedrom. I’ve been using wavedrom for some documents for some time now. There are a few things it hopefully gets, like more than one letter for those transitions markers, but that’s been requested already, so hopefully that’s ‘fixed’ soon.
Thank you for the article and kind words everybody. I will probably need Dark Skin for the WaveDrom, and will call it … hackaday ;) It would be nice to see WaveDrom integrated into the hackaday blog? Then people can exchange timing diagrams in the posts. I can probably help with it.
I am just downloading this and the editor now. The readme.md refers to <HEADER&ft; when I think you meant <HEAD>.
I see that your are using the onload event to render. If I make dynamic changes to the wavejson script then can I call the onload event a second time and will it re-render ok?
What if I use sliders to control a wavejson parameter ? is there some way to make this completely dynamic? or is it to resource intensive to do this? Also does the javascript build some sort of object to represent the wavejson ? it would be good to be able to access it with setAttribute().