The Smith chart is a staple for analyzing complex impedance. [W2AEW] notes that a lot of inexpensive test gear like the MFJ-259B gives you complex readings, but fails to provide the sign of the imaginary part of the complex number. That makes it difficult to plot the results on a Smith chart or carry out other analysis. As you might expect, though, he has a solution for you that you can see in the video, below.
A common method is to increase the frequency slightly. In a simple case, you’d expect the imaginary part — the reactance — to go down for a capacitive impedance and up for an inductive one. Unfortunately, this doesn’t apply in many common cases, including when you are measuring through a transmission line which is probably what most people are doing with this type of test gear.
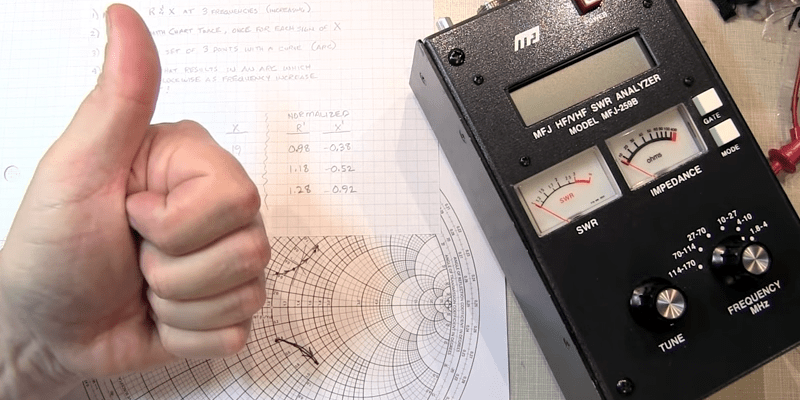
Oddly enough, the way to get the correct sign is to use the Smith chart itself. The steps are simple:
- Take measurements at 3 different frequencies
- Plot the 3 measurements on the Smith chart assuming reactance is positive; then plot them again assuming negative; you will plot 6 points in total
- Connect the positive set of points with a curve going from lowest frequency to highest; repeat for the negative set
One curve will go clockwise and the other will go counterclockwise. The clockwise curve will be on the points that are correct.
Sounds simple, but watching it actually done makes it more concrete. The example works out and agrees with an automated tool that creates a Smith chart automatically.
We are always fascinated by the Smith chart which is essentially an analog computer drawn on a piece of paper. Should you want a more intuitive approach to antennas, we recommend this one.


This is the SimSmith tutorials channel, recommended some time ago by W2AEW:
https://www.youtube.com/channel/UCKSyLSu4fm_1RHoO3Jvk4YQ
Huh, it never occured to me that you could just plot a smith chart by hand, I guess I’m spoiled by my club having a good Network Analyzer.
Just intime Ive been fighting with some antenna issues today!!
time to break out the smith chart -havent touched one since I was at school :(
Note that I published a “Part 2” video that discusses what to do if your data set crosses the real axis (i.e. the value of X changes among your measured frequency points). That video can be found here:
https://youtu.be/ON9htKshkIk
I use a really nice free Smith chart tool, it’s great for interactive RF matching and is free and is online!
http://www.will-kelsey.com/smith_chart/