So you just got something like an Arduino or Raspberry Pi kit with a few sensors. Setting up temperature or motion sensors is easy enough. But what are you going to do with all that data? It’s going to need storage, analysis, and summarization before it’s actually useful to anyone. You need a dashboard!
But even before displaying the data, you’re going to need to store it somewhere, and that means a database. You could just send all of your data off into the cloud and hope that the company that provides you the service has a good business model behind it, but frankly the track records of even the companies with the deepest pockets and best intentions don’t look so good. And you won’t learn anything useful by taking the easiest way out anyway.
Instead, let’s take the second-easiest way out. Here’s a short tutorial to get you up and running with a database backend on a Raspberry Pi and a slick dashboard on your laptop or cellphone. We’ll be using scripts and Docker to automate as many things as possible. Even so, along the way you’ll learn a little bit about Python and Docker, but more importantly you’ll have a system of your own for expansion, customization, or simply experimenting with at home. After all, if the “cloud” won’t let you play around with their database, how much fun can it be, really?
InfluxDB and Grafana wrapped up in Docker
Let’s get our parts together, starting with the database. InfluxDB is an open-source time series database that’s fast and intended for storing data that varies over time, like your sensor data. It processes this data using an SQL-like language. Writing SQL is nobody’s idea of fun, but it’s standard.
Grafana is an analytics platform that lets you visualize data and do stuff like generate alerts. It supports plugins which means that it allows integration with other software. It will be used to talk to our InfluxDB and then do some awesome stuff.
Docker is a containerization program which basically means that it allows us to put together our application, it’s dependencies, libraries and components together in a box so that it becomes easier for us to maintain and move things. Most importantly, it allows us to use containers that others have already prepared to make our lives easier.
Setup Docker
Now I am doing things in Linux, because I intend to migrate this to a Raspberry Pi once I’m done experimenting. That said, typing a couple of sentences into the command line is as easy as navigating drop-down menus anyway. The first step is to install docker and docker-compose:
sudo apt-get update && sudo apt-get install docker docker-compose
Not much else to it at this point. Restart you machine just in case. The documentation for the community edition can help answer a number of question that you might have.
We said already that docker images are readily available for use and so we need a docker image for InfluxDB as well as another one for Grafana. To get things up and running quickly, clone my repository from GitHub .
git clone https://github.com/inderpreet/py_docker_grafana_influxdb_dashboard.git
docker-compose up -d
chmod +x add_datasource.sh && ./add_datasource.sh
cd pyclient && chmod +x setup_env.sh && ./setup_env.sh
python test.py
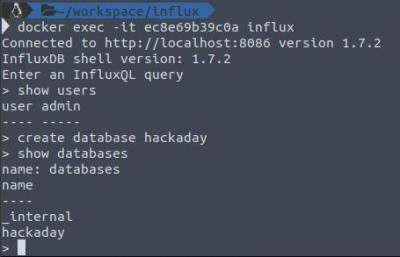
To test if things work, do a docker ps -a in a new terminal. This should return a list of containers running on your system. Copy the container ID from the list and run docker exec -it 1772a6e6387c influx
replacing the container ID for your machine. You should get an influxDB shell and can run commands such as:
show users

show databases

create database hackaday
We need to create a database to store our sensor readings so go ahead and do that. I have used “hackaday” as the name though it can be anything.
Quickly, testing things:
use hackaday
insert dummySensor v=123
insert dummySensor v=567
insert dummySensor v=000
select * from dummySensor
After typing the above in manually, you should be able to see the data in a time series.
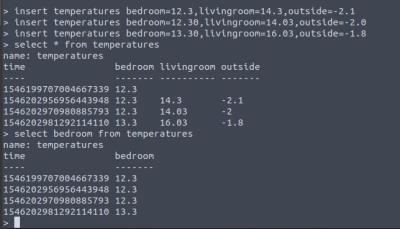 The time stamp is in nano seconds and there can be more than one data value for a particular series — maybe one from each sensor. Given some better names, you can look at any given sensor’s data using the following SQL query:
 select livingRoom from temperatureSensors. Note: If you’re populating a test database by hand, do no put spaces between the comma and next value field.
The Python script I have included will generate a sensor data in an exponential form and will reset the value to 1.1 once it hits 100.0 . This should allow us to plot a dummy curve in Grafana.
Set Up Grafana
Grafana is already up and running thanks to the docker and can be accessed at http://localhost:3000 Once you enter the URL in the browser, Grafana should greet you will a login prompt. You can then login with username/password admin/admin. (You might want to change this pretty soon!)
Next, check to see that your InfluxDB is recognized by Grafana, using “Add Sources” if not. Click Save and Test and to confirm. Make sure the default checkbox at the top is ticked.
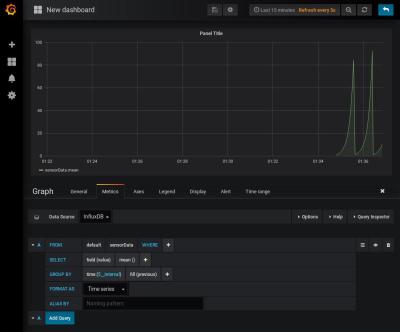 Next we should create a dashboard. From the left menu bar, select Dashboard>home and new dashboard. This should spit out an empty canvas with a few icons.
Select Graph and then click on the little title called Panel Title or simply press “e” on your keyboard. Then set it up so that:
– DataSource is set to InfluxDB
– selectMeasurement is set to sensorData
– fill is set to fill(previous)
And at the top, the refresh is set to 5 seconds and display for the last 15 minutes.
Reading Temperature
The reason that I have left the Python script outside of the Docker container is so that life will be easier when we make needed changes to read sensor data. For now, let’s take data in from a locally connected sensor attached to a microcontroller that can speak serial to your computer, to be read by a Python routine.
import serial

# replace with serial port name
ser = serial.Serial('/dev/ttyACM0')
ser.flushInput()

while True:
try:
temp_str = ser.readline()
temp = float(temp_str)
print(temp)
except:
print("Keyboard Interrupt")
break
As long as you can get your Arduino or equivalent to spit out numbers as a string, this script will receive them and translate them into floating point numbers. I leave the part about pushing the data into the InfluxDB as an exercise for the reader. (Hint: you can copy and paste code from/into the test.py I have provided.)
Raspberry Pi and the Sense Hat
The next stage would be moving to a Raspberry Pi. Got one for Christmas? You are in luck. Clone my repository from GitHub and do the same steps as before. Instead of the test.py, I have a sense_hat_temperature.py that can be executed. With this, you should be able to add sensorData and temperature and humidity values to the database.
Customization And Conclusion
The Docker system is configured using the docker-compose.yml file. In particular, there is a volumes variable that create a local folder influxdb_data which is where the data is written. You could configure it to write to say an external drive or even a network drive.
In case of the Raspberry Pi, this can be extremely useful. I wanted a way to be able to display sensor data easily while getting a few Python and Docker experiments going. This is just the beginning, though, since there is a lot more that can be done.
So far, our sensor device is an Arduino tied to the computer by a serial cable. If we want to take this wireless, we’ll need to think about getting the data from the sensor to the database. You could do worse than using MQTT and WiFi on an ESP8266. For power-sensitive applications, consider Bluetooth LE.
For now, get this system up and running and play around with local data. That way, when you build out the rest of your home sensing and automation network, the back end will be ready for you.


Say the title three times fast. :-)
Your shaky cloud based dashboarding service will probably last longer than your SD card, when you try to run a database on it.
Unless you keep it in RAM and only occasionally save “commits” to the SD-card.
Or use something like Alpine Linux.
Having saved data like this to an SD card for years, it’s fine.
Decent SD cards are perfectly good for this type of thing.
Avoid cheap ones and fakes.
The race is on!! Which is crappier: free cloud service business models or bargain-basement SD cards.
I dunno, because I use CD+RWs for my database.
this got a proper lol from me in the office.
Nice article, Thanks for highlighting both time series dbs and graffana. I think jupyter notebooks may also be useful as a way of visualising and dashboardinging data?
Aah Jupyter! Indeed a good suggestion and I intend to share a short write-up on that as well. This one was more to let people experiment with docker because support for the Raspberry Pi has really improved. Stay tuned.
I believe that the line:
chmod +x add_source.sh && ./add_source.sh
should read:
chmod +x add_datasource.sh && ./add_datasource.sh
Correct. I renamed them before I created a public copy hence the error. Thanks.
Configure docker and your database so that your database files are kept in a data directory outside of docker, that way you can “swap out” docker containers to upgrade software and you can fully test your container with a test database before you bring it live. Also, you only have to make backups of the data directory.
i missed that part too. the best idea would be to mount some share on your nas or file-server, which uses actual hdds, so your sd card will live longer and your data will be safer.
I think the data is persisted in a volume mapped out in the docker-compose as “influxdb_data”. You’ll find it in /var/lib/docker/volumes on a standard linux install.
if you want to override the volumes for different environments use multiple docker-compose files and specify docker-compose -f “filename1” -f “filename2” etc… by default docker-compose.yml and docker-compose.override.yml are automatically picked used unless you specify the -f switch.
INSERT INTO [hackaday].post_comments (post_id, user, comment) VALUES(338946, ‘me’, ‘Writing SQL is too fun.’)
… and before you know it, instead of analyzing data you’re building an enterprise data storage solution with so much complexity, dependencies and require so many moving parts that you’ll never even get to import your data.
Welcome to the cloud!
Oddly enough, using containers for your pet projects will save you a lot of time and effort in the long run, your app will keep running. Without containers your app will eventually break in a software update. With containers you can upgrade the database at your own speed and test it offline.
Containers!
All the virtues of statically linked libraries from the mid-90s, but post-millenial spin and extra bloat!
Only serious, but in this case it sure does make it easy to get the install done, and to pass the same config off to someone else.
For when one has the source code for linking. Otherwise it’s wrapping a known environment around something one doesn’t have complete control over. e.g. older games, etc.
your GitHub repository doesn’t have any such file as add_source.sh
my main question is: how do you know that a docker container that you download from the internet is going to have what you need and nothing else extra? Maybe i just dont fully understand docker and how it works, does anyone have any good introduction to docker links?
the answer is easy. you do not know what comes extra,when you simply download docker images from the web – not even when you download from the official dockerhub. the security of your source material is one of the biggest challenges when using docker for enterprise scenarios. in my book, the only way to get clean docker images, is to build them yourself – and that is quite easy to do. once you get it, docker is a charme to use. Use images and dockerfiles from the web to learn some best practice for your software of choice, but do not use it for production systems.
You don’t. It’s a fundamental flaw imo. The only way to be sure is to build your own from scratch. Then you disappear down the trust rabbit hole. Can you trust the package? The compiler? The bios? At the end of the day, just great sicker as you would any other untrusted networked device — firewall, dedicated vpn & hope for the best…
S/great sicker/treat it.!
Many projects provide their Dockerfiles and thus you can review it and then build the image yourself. As long as you trust the base image(s) then you are good to go. I typically trust major vendors of distros.
In practice, I think binary only images or pre-built-for-convenience ones are safe if they can only access the data they are intended to process. This means running them on separate hardware or in a VM. Some configuration is needed to isolate Docker containers on the same host from eachother or from accessing the host as root.
Many projects provide their Dockerfiles and thus you can review it and then build the image yourself. As long as you trust the base image(s) then you are good to go. I typically trust major vendors of Linux distros as the base image.
In practice, I think binary only images or pre-built-for-convenience ones are “safe enough” if they can only access the data they are intended to process. This means running them on separate hardware or in a VM. Some configuration is needed to isolate Docker containers on the same host from each other or from accessing the host as root.
It’s no worse than downloading and installing any linux distribution.
(Have you vetted every package, file and service in rasbpian?)
That said, Docker containers are heirarchical in the sense that a container definition is (usually) based on another container definition. So eg your application’s container might be based on an official image like ‘docker/node-js’ and in turn on Alpine linux.
“How do you trust?”
It’s not just an infosec question. It’s deeply revealing about the human condition. Novels have been written.
I hope I don’t sound too tongue-in-cheek: this is seriously at the root of the issue and it’s deeply metaphysical. But also security-relevant.
Gets interesting when one’s paranoid about themselves. But trust is ultimately about reputation. Hoard it, nurture it, and never let it out of your sight.
Interesting article. Thank you.
> Restart you [sic] machine just in case.
You should never need to restart your machine from installing some generic package. Even “just in case”. Better advice would be to run the necessary daemon in question. In this case:
sudo systemctl status docker
Also you need to properly indent the test.py code. It won’t work as it stands. Probably most readers here understand this but proper formatting would be more convenient for everyone.
If you do end up using MQTT to publish the sensor data, consider using Telegraf to write the MQTT sensor data into InfluxDB. It becomes as simple as defining the topic to subscribe to in the Telegraf config, and Telegraph will subscribe to that topic and push the sensor data directly into Influx for you. If you have good MQTT naming convention, you can use wild cards in Telegraf MQTT topic subscriptions and you never have to touch the configuration file again even if you add new sensors. Everything just shows up in Influx with unique sensor topic name and is available for visualization in Grafana.
I have some examples here:
https://www.hackster.io/erictsai/lora-tooth-small-ble-sensors-over-wifi-lora-gateways-0aa109
Maybe I missed that point, but (correct me if I’m wrong) it should be mentioned that you need to create the cutom image starting from one for ARM architecture (the version depends on the Raspberry model). Doing the project in your linux PC and the move that in your rasperry won’t work out of the box, or at least that was what I experienced: I had to rebuild the images of the dockers involved with ARM images as starting point (you can find them on docker repos).
Anyway, it’s a great project…
I have two repositories for each the x86 and RPi version. I just updated the readme and links.
So what version of Docker and Docker-compose are you assuming/requiring here? Your README.md is lacking in details, and you missed the step where you cd into the directory you pull down with Git. Which tells me you didn’t test this in a brand new system. I’m running Debian Stretch for my testing…
I just did a quick update to the readme files though there may lack total completeness. The sample code is provided to help you get started while tinkering and making mistakes. You can chalk up the missing cd commands to ‘I am not a robot’
I’m seeing this error for the docker-compose line
ERROR: Version in “./docker-compose.yml” is unsupported. You might be seeing this error because you’re using the wrong Compose f
the `services` key, or omit the `version` key and place your service definitions at the root of the file to use version 1.
For more on the Compose file format versions, see https://docs.docker.com/compose/compose-file/
Looks like hypriot moved the data storage location to /data. Had to dig into the config to see why I wasnt getting the data in the typical /var/lib/influxdb location.