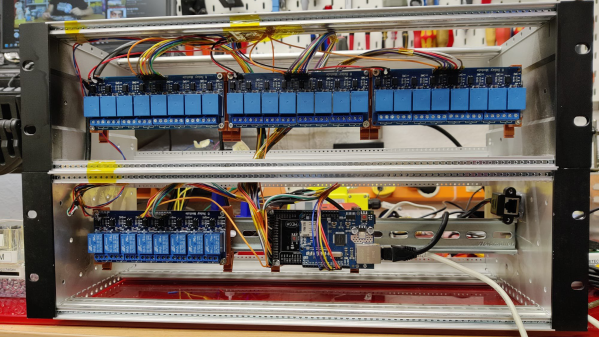
A DIY DIN rail mounted rack of PLC components for home automation

2024 Home Sweet Home Automation: A DIY SCADA Smart Home

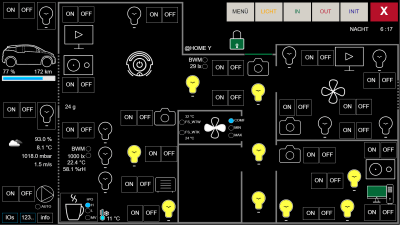
A SCADA-style display of icons and control buttons
Touch-screen control and monitoring

Supervisory control and data acquisition, or SCADA, systems sit in the background in industrial settings, performing all kinds of important jobs but in an ad-hoc setup, depending on the precise requirements of the installation. When we think about home automation systems, they’re pretty much the same deal: ad-hoc systems put together from off-the-shelf components and a few custom bits thrown in. [Stefan Schnitzer] clearly has significant knowledge of SCADA in an industrial setting and has carried this over into their home for their entry into the Hackaday 2024 Home Sweet Home Automation Contest. Continue reading “2024 Home Sweet Home Automation: A DIY SCADA Smart Home”

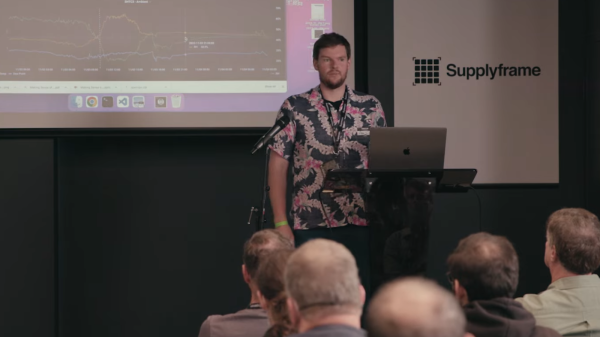
Image of the presenter on the podium, in front of the projector screen with graphs shown on it

Supercon 2022: [Alex Whittemore] On Treating Your Sensor Data Well

If you build your own devices or hack on devices that someone else has built, you know the feeling of opening a serial terminal and seeing a stream of sensor data coming from your device. However, looking at scrolling numbers gets old fast, and you will soon want to visualize them and store them – which is why experienced makers tend to have a few graph-drawing and data-collecting tools handy, ready to be plugged in and launched at a moment’s notice. Well, if you don’t yet have such a tool in your arsenal, listen to this 16-minute talk by [Alex Whittemore] to learn about a whole bunch of options you might not even know you had!

For a start, there’s the Arduino Serial Plotter that you get for free with your Arduino IDE install, but [Alex] also reminds us of the Mu editor’s serial plotter – about the same in terms of features, but indisputably an upgrade in terms of UX. It’s not the only plotter in town, either – Better Serial Plotter is a wonderful standalone option, with a few features that supercharge it, as [Alex] demonstrates! You don’t have to stop here, however – we can’t always be tethered to our devices’ debugging ports, after all. Continue reading “Supercon 2022: [Alex Whittemore] On Treating Your Sensor Data Well”

Long-Range Thermocouple Sensor Sips Battery Power

Sometimes you need to know the temperature of something from a ways away. That might be a smoker, a barbecue, or even a rabbit hutch. This project from [Discreet Mayor] might just be what you’re looking for.

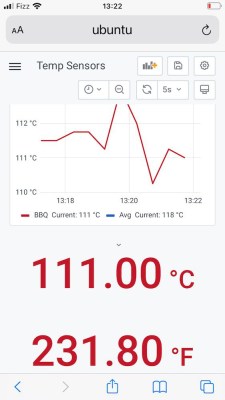
[Discreet Mayor] remotely keeps an eye on the meat, but doesn’t blab about it.
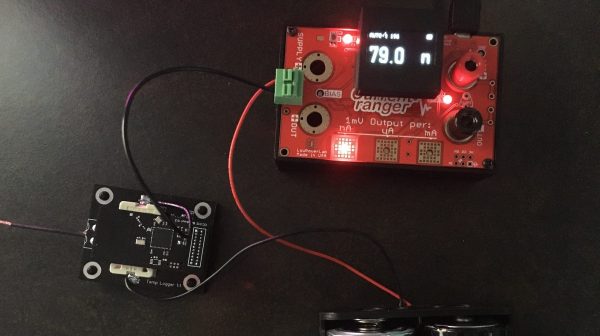
It consists of a MAX31855 thermocouple amplifier, designed for working with commonly-available K-type thermocouples. This is hooked up to a Texas Instruments CC1312 microcontroller, which sends the thermal measurements out over the 802.15.4 protocol, the same which underlies technologies like Zigbee and Thread. It’s able to send radio messages over long distances without using a lot of power, allowing the project to run off a CR2023 coin cell battery. Combined with firmware that sleeps the system when it’s not taking measurements, [Discreet Mayor] expects the project to run up to several years on a single battery.

The messages are picked up and logged in a Grafana setup, where they can readily be graphed. For extra utility, any temperatures outside a preset range will trigger a smartphone alert via IFTTT.

Keeping a close eye on temperatures is a key to making good food with a smoker, so this project should serve [Discreet Mayor] well. For anyone else looking to monitor temperatures remotely with a minimum of fuss, it should also do well!

More Software-Defined Radio Projects Using DragonOS

DragonOS, a Debian-based Linux distribution specifically packaged for software-defined radio functionality, roared onto the wavelengths during the beginnings of the various pandemic lockdowns last year. Since then [Aaron], the creator of the OS, has been busy adding features to the distribution as well as creating plenty of videos which show off its capabilities and also function as how-tos for people who might want to learn about software-defined radio. The latest is a video about using this software to detect radio signals in certain specified spectrums.

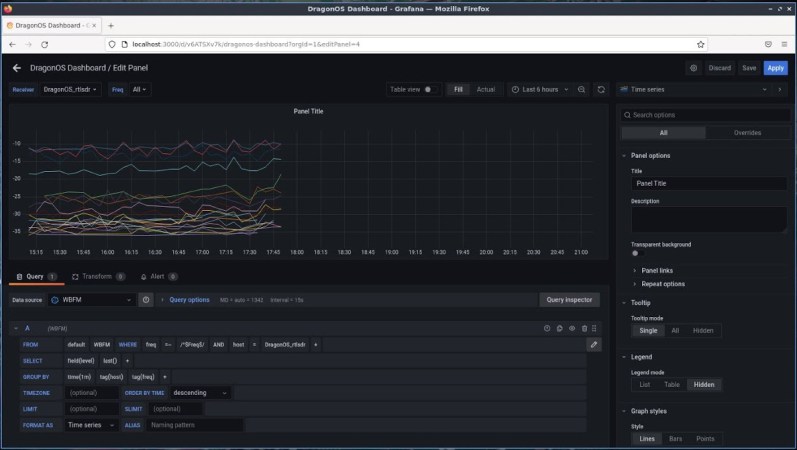
This build uses two  RTL-SDR devices paired with the DragonOS software suite to automatically detect active frequencies within a specified frequency range and that aslo exceed a threshold measured above the average noise floor. The video includes the setup of the software and its use in detecting these signals, but also includes setup of influxdb and Grafana which provide logging capabilities as well. Using this setup, multiple receivers either local or over the internet can then be configured to dump all the identified frequencies, powers, and time stamps into DragonOS.

[Aaron] has also been helping developers to build the SDR4space.lite application which includes GPS support, so he hopes that in a future video a user will be able to easily associate location to identified frequencies. Projects like these also serve as a reminder that getting into software-defined radio is as easy as buying a $10 USB radio receiver and configuring some free software to do anything that you can imagine like tracking ships and airplanes in real time.

Continue reading “More Software-Defined Radio Projects Using DragonOS”

Raspberry Pi Helps Racer Master The Track

Looking to give himself a competitive edge, racer [Douglas Hedges] wanted to come up with a system that could give him real-time feedback on how his current performance compared to his previous fastest lap time. Armed with a Raspberry Pi and some Python libraries, he set out to add a simple telemetry system to his car. But as is often the case with these kind of projects, things just started snowballing from there.

The Raspberry Pi based data acquisition system.

At the most basic level, his system uses GPS position and speed information to light up a strip of RGB LEDs on the dashboard: green means he’s going faster than the previous best lap, and red means he isn’t. Any interface more complex than that would just be a distraction while he focuses on the track. But that doesn’t mean the Raspberry Pi can’t collect data for future review after the race is over.

With the basic functionality in place, [Douglas] turned his attention to collecting engine performance data. It turned out the car already had some pre-existing equipment for collecting metrics such as the air-fuel ratio and RPM, which he was able to connect to the Raspberry Pi thanks to its use of a well documented protocol. On top of that he added a Labjack U3 data acquisition system which let him pull in additional information like throttle position and coolant temperature. Grafana is used to visualize all of this data after the race, though it sounds like he’s also considering adding a cellular data connection vehicle data can be streamed out in real-time.

In the past we’ve seen onboard data collection systems make real-world races look more like their virtual counterparts, but it seems like the solution [Douglas] has come up with is more practical in the heat of the moment.

Continue reading “Raspberry Pi Helps Racer Master The Track”

Raspberry Pi Cluster Shows You The Ropes

Raspberry Pi clusters are a common enough project, but a lot of the builds we see focus on the hardware side of the cluster. Once it’s up and running, though, what comes next? Raspberry Pis aren’t very powerful devices, but they can still be a great project for learning how to interact with a cluster of computers or for experimental test setups. In this project from [Dino], four Pis are networked together and then loaded with a basic set of software for cluster computing.

The first thing to set up, after the hardware and OS, is the network configuration. Each Pi needs a static IP in order to communicate properly. In this case, [Dino] makes extensive use of SSH. From there, he gets to work installing Prometheus and Grafana to use as monitoring software which can track system resources and operating temperature. After that, the final step is to install Ansible which is monitoring software specifically meant for clusters, which allows all of the computers to be administered more as a unit than as four separate devices.

This was only part 1 of [Dino]’s dive into cluster computing, and we hope there’s more to come. There’s a lot to do with a computer cluster, and once you learn the ropes with a Raspberry Pi setup like this it will be a lot easier to move on to a more powerful (and expensive) setup that can power through some serious work.

Howto: Docker, Databases, And Dashboards To Deal With Your Data

So you just got something like an Arduino or Raspberry Pi kit with a few sensors. Setting up temperature or motion sensors is easy enough. But what are you going to do with all that data? It’s going to need storage, analysis, and summarization before it’s actually useful to anyone. You need a dashboard!

But even before displaying the data, you’re going to need to store it somewhere, and that means a database. You could just send all of your data off into the cloud and hope that the company that provides you the service has a good business model behind it, but frankly the track records of even the companies with the deepest pockets and best intentions don’t look so good. And you won’t learn anything useful by taking the easiest way out anyway.

Instead, let’s take the second-easiest way out. Here’s a short tutorial to get you up and running with a database backend on a Raspberry Pi and a slick dashboard on your laptop or cellphone. We’ll be using scripts and Docker to automate as many things as possible. Even so, along the way you’ll learn a little bit about Python and Docker, but more importantly you’ll have a system of your own for expansion, customization, or simply experimenting with at home. After all, if the “cloud” won’t let you play around with their database, how much fun can it be, really?

Continue reading “Howto: Docker, Databases, And Dashboards To Deal With Your Data”