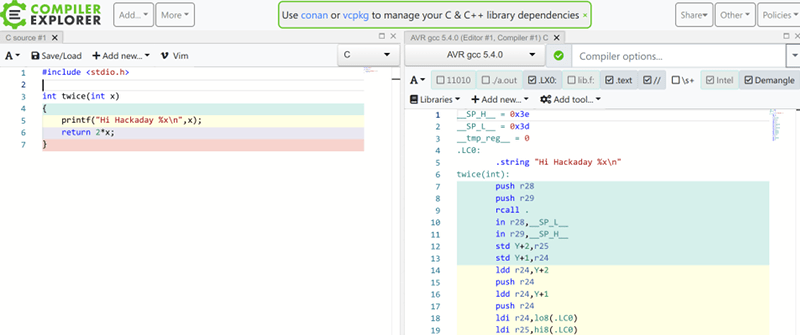
We don’t know what normal people argue about, but we know we spend a lot of time arguing about the best microcontroller, which editor is the best, and what language or compiler does the best job. The problem with all those compilers is getting them loaded and digging into the generated code. If you too spend your time thinking about those things, you ought to have a look at [Matt Godbolt’s] Compiler Explorer. We know that hosting an IDE-like web page and compiling code is old hat — although [Matt’s] site has been around quite some time. But [Matt’s] doing it differently. The code you build on the left hand pane shows up as assembly language on the right hand side.
There are plenty of options, too. For example, here’s a bit of C code from the site’s example:
int square(int num) {
   return num * num;
}
Here’s the corresponding assembly from gcc 9.2 for x86-64:
square:
  push rbp
  mov rbp, rsp
  mov DWORD PTR [rbp-4], edi
  mov eax, DWORD PTR [rbp-4]
  imul eax, eax
  pop rbp
  ret
However, ARM64 gcc 8.2 outputs:
square:
  sub sp, sp, #16
  str w0, [sp, 12]
  ldr w1, [sp, 12]
  ldr w0, [sp, 12]
  mul w0, w1, w0
  add sp, sp, 16
  ret
There are options for many compilers including AVR. 6502, and MIPS. Even more interesting is there is support for many other languages ranging from FORTRAN to Rust and Go. It is a nice touch that the source code lines get colors that match the region of the disassembly that corresponds to that line.
As a side note, you can click the Output button at the bottom and actually run your test program, if you like. If you are interested in how the system works, there’s a document that describes how the system leverages Amazon’s elastic cloud and Docker. Of course, [Matt’s] made a lot of changes since that document was written, but at least it will give you a general idea, plus you can always go dig around in his GitHub repo.
We’ve gotten to the point where we sort of enjoy these web-based playgrounds for learning purposes. We probably wouldn’t write our million dollar super secret code on it, but who are we kidding? No one really wants to read the source to our latest IoT garage door.


Compiler Explorer is an invaluable tool for optimizing code, especially for checking the validity of tricks like bitwise math and unrolling loops.
Rule #1 when analyzing generated code: debug code is worthless. Unfortunately the default example you posted is debug code. It would be more interesting, and also much simpler to understand, if you posted the examples with -O2 in the compiler options.
Anyway, I love this amazing tool. I use it frequently at work. Beside checking differences between compilers and what code is most optimized, last time I discovered an obscure compiler option that actually really makes a difference.
Check the difference between these two:
https://godbolt.org/z/qx7-aZ
https://godbolt.org/z/ULnyd_
It was just the stock example provided by the site, but sure. Honestly, I think the optimization level would depend on what you are trying to understand — the function of the code, or what the compiler is doing exactly to your code that you may want to further optimize or you suspect the code generation is bad. But sure, you may want to use different options than the stock example.
clang does that with -O2. I find clang a lot more performant and error messages actually make sense.
That’s very neat! I was just wondering how gcc and clang would handle copying my 7-byte structs.
Edit: way too much fun and my 1366 pixels isn’t cutting it. I’m going to need a much wider screen.
gcc copies 4 + 2 + 1 byte.
clang does 4+4 byte copy with a 1-byte overlap, but only in the memset(A,0,7); and memcpy(A,B,7); caces, not for the *A=*B; case.
What is with the calling convention “The registers RDI, RSI, RDX, RCX, R8, and R9 are used for integer and memory address arguments” for x86_64 ?
Details: https://en.wikipedia.org/wiki/X86_calling_conventions#System_V_AMD64_ABI
Related to the topic, check Matt’s talks on youtube. Especially his “What has my compiler done for me lately” series :D
Matt did an interview / episode with embedded.fm a couple of years back which is worth a listen.
https://embedded.fm/episodes/190
I am constrained to point out that debug cose, while not optimal code, is built so that it is possible to point to a set of (usually contiguous) instructions that implement each statement, with no overlaps. In fully optimized code, the attribution of generated code to specific source lines is not always possible. The attributions are generated by the compiler itself so that debugs can single-step by statement. In optimized code, the concept has little meaning in many cases though the compiler does the best it can. This difficulty is reflected fully in the Compiler Explorer.