
If a temperature sensor takes a measurement in the woods but there’s nobody around to read it, is it hot out?
If you’ve got a project that’s collecting data, you might have reasons to put it online. Being able to read your data from anywhere has its perks, after all, and it’s key to building smarter interconnected systems, too. Plus, you can tell strangers the humidity in your living room while you’re out at the pub, and they’ll be really impressed.
Taking the leap into the Internet of Things can be daunting however, with plenty of competing services and options from the basic to the industrial-strength available. Today, we’re taking a look at two options for logging data online that are accessible to the beginner.
Key Things To Look For
When trying to find an online logging platform, there’s a few things to consider. Ease of use is a primary consideration, as those just getting their feet wet with the Internet of Things don’t need to be scared away by complexity. Anything involving compiling obscure libraries or setting up complex databases is out. Additionally, cost is also a factor. Expensive subscriptions are a discouragement for those who wish primarily to dabble. For this article, we’ve selected two options that have a good feature set and a low bar of entry for beginners.
IOTPlotter
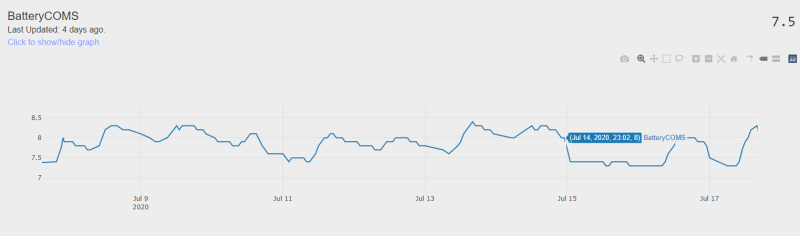
For many IoT projects, the aim is to get a bunch of sensors, monitor the output, and make some graphs. If that’s your use case, IOTPlotter, as the name suggests, may be just the tool for you. Free to use, it’s perfect for low-key logging of numerical data.
To use IOTPlotter, it’s necessary to create a feed, which generally would correspond to a single device. This feed can contain several graphs, pertaining to different sensors or data. Writing to a feed is easy, achieved most readily through Python code or any other platform capable of making a basic HTTP request. To prevent random interlopers from making unauthorised changes, a feed is secured by an API key which is required to submit data and make requests. While it’s by no means a high-end security measure, it’s more than enough for the average DIY project.
A smattering of other features make IOTPlotter just that little bit more useful. It’s possible to combine multiple data feeds onto a single graph, and also automatically export graphs in PNG format for external use. This is particularly applicable to situations where you may wish to display the data on an external website or in a mobile phone application. There’s also privacy options that allow you to close your feed so that it’s for your eyes only. Perhaps the only feature you may miss at this level is data export – there’s no easy way to spit out a CSV file of all your collected data to date.
The documentation for the service is succinct – barely two pages long! Those with basic Python experience can be up and logging within half an hour, including initial sign up. If your applications swerve towards the more powerful, there are rate limits to consider, and as a free service, it doesn’t come with the same guarantees as a full-fat commercial offering. But if you’re working at that level, it’s likely IOTPlotter is not the solution for you anyway.
Google Sheets
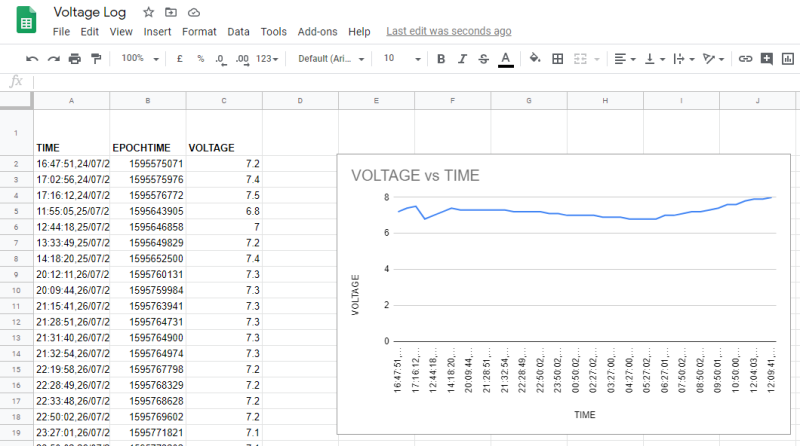
If your logging needs are more serious, and you’ve got designs on doing some serious number crunching down the track, you’ll want to focus on storing your data in an accessible format. Throwing it into a spreadsheet is a great way to go, and Google Sheets is a great online platform for just such a purpose. When all you need is to handle creating, reading, updating, and deleting records, we call this a CRUD app. While it’s more common to use a full-fat database, for many applications, Google Sheets is powerful enough, and takes a lot less work to set up. As a bonus, it’s already set up to access from anywhere and can easily be shared with others, too.
As a spreadsheet, you have the full flexibility to write in data any way you like. However, this also means that there’s a little more complexity involved in writing to Google Sheets. There’s also authorization required via OAuth 2 and the Google API Console. It’s not as easy as working with IOTPlotter, but still achievable in a few hours for the average user. These requirements mean that it’s generally easier to work with Google Sheets using a computer, like a Raspberry Pi, rather than a microcontroller. [Greg Baugues] has a great guide to getting the job done for those working in Python. However, it is possible to use workarounds to get the job done on a more lightweight platform. As [Shishir Dey] demonstrates, it’s possible to submit to Google Sheets with an HTTP request with the help of a little scripting.
The benefit of such a method is that exporting data for further analysis is trivial. Simply clicking “File->Download” provides a variety of options, including CSV, for export. This allows the data to be used in software like MATLAB or other scripting languages, allowing you to run statistics and generate plots till the cows come home. It requires a little extra legwork, but for scientific projects, this flexibility is key to getting good results from data.
Other Options
For those looking for fancier interfaces or more bulletproof offerings, other options do exist. We’ve run features before on IoT services, and also discussed the benefits of MQTT as a data transport method. If what we’ve discussed here today doesn’t quite fit the bill, do a little further reading on what’s out there and see what best suits your use case. When you’re project is done, take some photos and drop us a line, and as always, happy hacking!


I’ve wanted a good data logger and plotter that actually looks good and interacts well on a mobile device. A built-in assumption to these and many other similar projects is that I’m on a desktop with a mouse and keyboard. Does anyone know of a good project or library that is designed for mobile visualization?
I use ThingSpeak for an IoT temperature sensor project, and there are various 3rd party apps available for visualising the feed data (ThingSpeak also has integration with MATLAB so you can use MATLAB code to autogenerate plots as well)
Haven’t tried IOTPlotter from the description above they are similar.
Or you could keep your data off other peoples computers (“the cloud”) and host it yourself running Home Assistant on a raspberry pi. It has a mobile app for both iOS and Android, and if you need more than the built in istory graphs you can run Grafana as an addon.
Does Adafruit still have an IOT logger thing? I liked it as it was easy to set up and display graphs and such, but it was hella expensive at $120 per year so I dropped it after a few months. Had it been more reasonable I’d still be playing with using it for things.
adafruit.io is free, and if you need to do more besides the free version there is a plus account.
Hm, I’ll have to look at it again. My recollection was there was one specific feature that I needed that precluded my using the free version, but now I don’t recall what that was.
Does it work as stand alone app (installed on rpi)?
Actually the Adafruit service is reasonable, because unlike most api-as-a-service companies they didn’t hide the actual cost of IoT systems. Most IoT based services are normally unsustainable, as the bill for the loss-leader device eventually burns though the hype. Amazon and Google are the only product exceptions I have seen avoid this reality given they sell services directly to customers.
A free thermometer log seems easy, and it is while you have a small set of users. However, eventually the storage, access, and cpu costs start to balloon quickly. Notably, services that start as free loss-leaders, must additionally make up for these losses by hitting the retained users with higher bills.
Ironically, the people who build standalone MQTT systems usually win this in the long run. ;-)
Yeah, I have a single Bosch/Sensortec BME280 sensor up via an ESP8266 on an Adafruit IO (AIO) dashboard showing temperature, humidity, barometric pressure (all measured), and dew point (calculated). Samples are uploaded three times a minute. There are four gauges and four graph plots, one each per dataset. This single dashboard with four datasets updated three times a minute pretty much maxes-out the free tier on AIO. I might be able to sample less often and add more datasets while still remaining below the AIO free tier caps, but then the data would become too granular, I want to observe my HVAC system cycling over time.
I am using HTTP to upload the data, there’s no need for anything more complicated with a simple case like this. AIO is pretty simple to learn and use. There is a tutorial and example templates. The dashbord is pretty easy to build, you add dataset feeds, drag-and-drop element blocks, then edit the block parameters via dialog boxes. Pretty standard stuff. Support exists via the Adafruit Community Forum. The only negative things I can say about AIO are that the drag-and-drop element blocks are pretty, but they are are kind of big and clunky. If you need to build a highly customized dashboard for many complex datasets, AIO is probably not for you. Also, it is rather pricey when you get past the free caps.
They do, and it’s hot garbage.
why?
I use Node-Red, InfluxDB and Grafana to log my data on a Raspberry Pi running a small SSD. It keeps it out of the cloud, and is very easy for an ESP32 to use. Andrea Spiess has a recent video on how to set all that up with IOTStack, which is very easy.
This!
Agreed, IoT logging != cloud services. Why depend on the cloud when you ban buy a $35 supercomputer (ok compared to the right stuff it’s a supercomputer, data logging is well within capability)?
Other useful projects are teamspeak, grafana and I strongly suggest the multi-language library plot.ly, especially if you have specific needs in your charting.
teamspeak = thingspeak
How do you spell Comma Delimited Text file? Sorry google sheets isn’t my first go to.
Twitter works great for logging your toilet flushes too.
I find graphana looks ok on mobile, in general. Problem comes when you add too much stuff on a graph like show me a 55 bar graph plot. But you definetelly have freedom to configure things to get a functional dashboard.
You can also look at IOT stack of you want to run on a raspberry pi. It is an automatic installation for a lot of open software for iot.
https://github.com/gcgarner/IOTstack
You can have your own website with domain name for $60 or less per year. You have PHP, SQL databases, lots of storage, accessible anywhere in the world. Create an API, collect data, display it. Use your website for other things too. Allow others to use your API’s. Your ESP32 posts to your site, or utilize Twillio for non WiFi devices that use SIM cards.
another option is to use Oracle’s free Tier cloud servers ( https://www.oracle.com/cloud/free/ ) and run a TIG stack (Telegraph, InfluxDB and Grafana) on there.