Back in the 1980s, spectrum displays on audio equipment were absolutely must have, and the aesthetic came to define the era. This lingered on through the 1990s, and remains a cool look even to this day. [Arduino Guy] decided to put together such a display using a Raspberry Pi and a large LED display.
The LED display in question is of the 64×64 RGB type, available from Aliexpress and other electronics suppliers online. To run the display, an Adafruit RGB Matrix Hat is used with the Raspberry Pi 3B, which makes driving the panel a cinch. The visual effect is run via a Python script, which plays a wave file and produces the spectrum graphics via a Fast Fourier Transform.
While the code isn’t able to act as a general-purpose equalizer display for any content played on the Raspberry Pi, creating such a script could be an entertaining exercise for the reader. Alternatively, the Pi could be hooked up to a microphone to run the display based on ambient room noise. In any case, we’ve seen great projects like this before, such as this laser-based display. Video after the break.


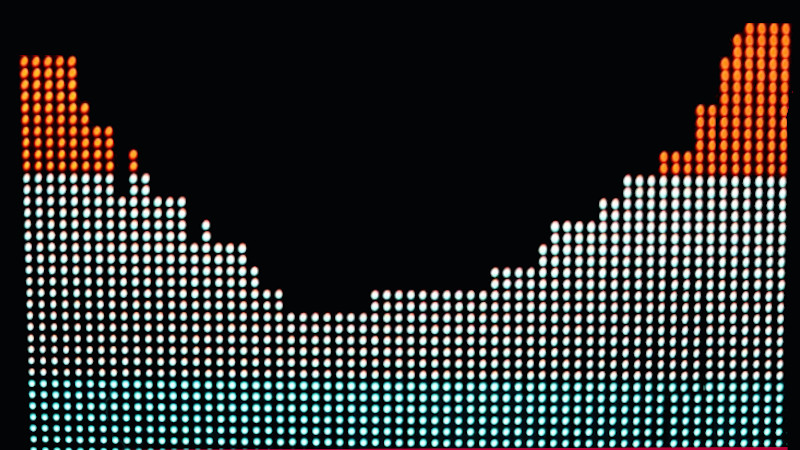
That’s too…. digital. Black corners at 90° scratch my eyes, right there in the middle of led display where some frequencies do mot get any corresponding reactions. It’s cool but the math is far from perfect.
CRT is the undisputable QUEEN – check this amazing work by mr. Todd Kumpf:
https://vimeo.com/75492190
Powered by Raspberry Pi.
I haven’t checked this implementation, but with a normal spectrum visualiser there wouldn’t be any frequencies (within the total frequency range) that don’t get reactions. I suspect the total range of this implementation is probably too narrow which is making it look like the music is hugely bassy and trebley when it’s really not.
The code is very short. He
– calculates the FFT over 4096 samples
– throws away the value for the highest frequency while keeping the one for DC
– takes the logarithmic absolute of the complex values
– averages 32 adjacent values to get the bar length for the 64 columns of the display
Hmm… The code shown on hackster.io doesn’t take into account that the samples for the left and right channel are interleaved. Maybe that’s why he threw away the highest frequency result.
In the video it looks like the left side of the display is for the left channel and the right side of the display for the right channel. So the flatness in the middle might be caused by an audio file that is lowpass filtered way below the Nyquist frequency, as common with low to medium bitrate lossy compression algorithms. The power we see in the high frequencies might be caused by the rectangular window (i.e. no window).
I think it might be more efficient to calculate the FFT over 128 samples if he ends up averaging them into 64 values with linear frequency scale. Maybe also use a window function to reduce leakage of power into adjacent FFT bins. For the drawing I would not clear the whole display each time before drawing the bars but instead shorten or extend the previously drawn lines to avoid flicker.
Really cool, but WHAT HAVE YOU DONE TO YOUR MIDS?!?!?!
From the title, I was waiting for a system analyzing the spectrum of given LEDs and displaying them. To allow the comparison of color reproduction etc. That would’ve been cool.
This is someone buying some stuff and plugging it together? Not usual hackaday level? Maybe its just a bit of lighthearted messing about and i should dial down my grumpiness
No, it’s warranted. Plugging in a premade panel and running a generic FFT library behind it (which is missing a large portion of the frequencies) is not the level of quality expected from HAD.
There’s definitely something “off” about the spectrum here. Too little action in the mids/highs, and too much bass. Anyone know what’s up?
I looked at the code–I don’t speak python–and it looks like they did convert the vertical axis to log scale–so that’s good. But it looks like the frequency axis is left linear–which will make it look crazy. They also don’t seem to be using any windowing which will add a lot of high frequency noise–which is probably that lump off to the right side.
If someone who actually speaks python can take a look and verify that, I’d appreciate it.
The more I look at it, the more I think I misread it. I think they’re not combining the real and complex outputs of the FFT, so we’re seeing 0-Fs/2-0 So the highest frequency is in the middle, but the right side the the (mirrored) complex output of the FFT.
The rfft function from numpy doesn’t output the redundant complex conjugated part of the spectrum. I believe the code shown on the website is simply not the version used for the video.
Not to be too harsh on the project (after all, they actually finished it and made something themselves), the signal processing part should not be taken as a reference.
First issue is the ignored interleaving of the audio channels.
The possible reason for the bathtub shape is a bug in the conversion from complex to power spectrum: the squaring is applied on the log values. Small magnitude (<<1) results into a large negative value in log-domain, which is then squared, leading to high "power" value.
The Nyquist sample is probably discarded to get an array size that is an integer multiple of the subsampling size. Including the Nyquist sample the size would be (N/2)+1.
“This is someone buying some stuff and plugging it together?”
Beats the days of making one’s own electrons. But 2D spectrum displays are kind of old hat with dedicated chips for it. Current trend is 3D.
Worse yet, it’s someone who was *given* stuff to plug together. It’s sponsored by the people who sell the display.
Built something like this years ago but instead of using a wav file i used an usb sound card for line in and instead of a led hat for the pi i used a dma library to drive the ws2812 leds and since 50 FPS weren’t enough i changed the library to utilize both available pwm pins on the pi. It was a little bit sketchy but it worked fine. A new version that i built uses a teensy instead of the pwm pins on the pi.
https://www.youtube.com/watch?v=g29s83AVBUs
Something is strange with it. I think the guy needs to get himself a generator and inject each bands freq and level to make sure that his math is right in the code. From looking at its response he’s way off.
I used the generator in Audacity for a frequency sweep for my spectrum analyzer. It also showed me the attenuation vs freq. of the low pass anti-alias filter.
Built something similar many years ago. Could stream off google play music or from a file. Was trying to make it so it could take a line in but wasn’t able to get the AGC right.
https://youtu.be/YFZku60ZxKU
My first thought was someone called ‘Arduino Guy’ was using a raspberry pi… OK, not a big deal, even though an Arduino has ample compute power for this, he likes ALL compute platforms…
I’m not impressed with the implementation though – mirrored spectrum suggests poor understanding of FFT and timefrequency, and with the compute cycles available to a pi it doesn’t even do monitoring of a real-time audio input and has to use an internal file?
Nice stepping stone, but 64×64 (square) is a lousy aspect ratio for a spectrum analyser (they are usually wide and short).
Perhaps if he used bottom 64×32 for left, top 64×32 for right, implements real-time input, and gets a grip on FFT real/imaginary components it could be good…