A CRT Audio Visualiser For When LEDs Just Won’t Do

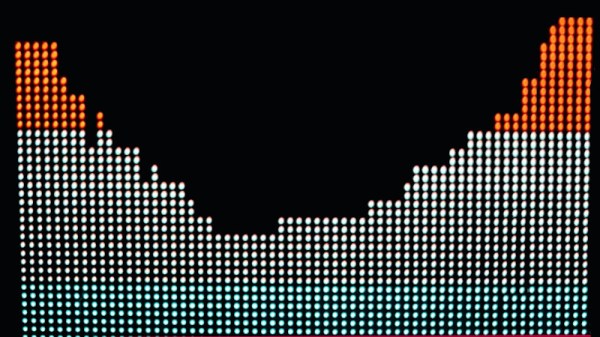
It has been a recurring feature of consumer audio gear since the first magic eye tube blinked into life, to have some kind of visualization of the sound being played. Most recently this has meant an LED array or an OLED screen, but [Thomas] has gone one better than this with a CRT television converted to perform as a rudimentary oscilloscope.

The last generation of commonly available monochrome televisions were small 5″ CRT models made in China. They never received digital tuners, so as digital TV has become the norm they are now useless to most people. Thus they can often be found for pennies on the second-hand market.

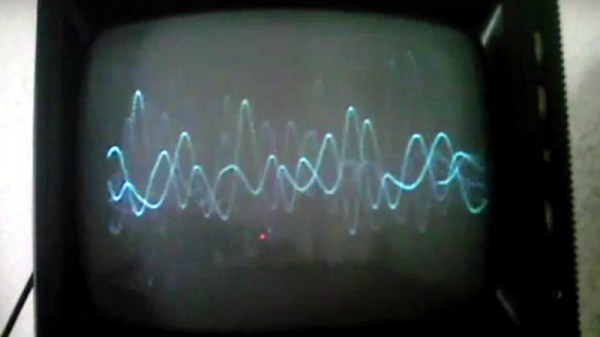
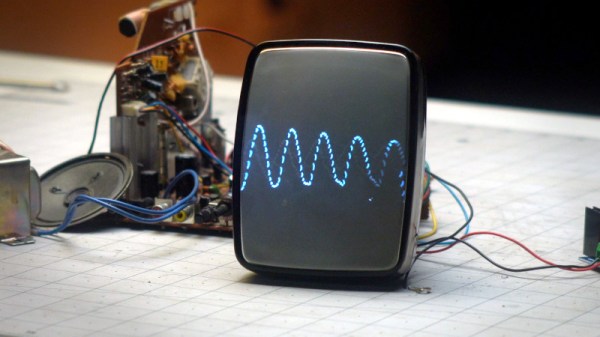
[Thomas]’s hack involves gutting such a TV and retaining its circuitry, but disconnecting the line driver from the deflection yoke. This would normally leave a vertical line on the screen as it would then be moved only by the frame driver at 50 Hz for PAL or 60 Hz for NTSC. By connecting an audio loudspeaker amplifier to the line deflection yoke he gets that low quality oscilloscope. It would be of limited use as an instrument, but few others will have such a cool audio visualizer. He’s viewing the screen in a portrait orientation, we’d be tempted to rotate the yoke for a landscape view.

It’s worth pointing out as always that CRT TVs contain high voltages, so we’d suggest reading up on how to treat them with respect.

Continue reading “A CRT Audio Visualiser For When LEDs Just Won’t Do”

Character VFD Becomes Spectrum Analyzer

These days, streaming services are a great way to listen to music or podcasts on your computer or on the go. However, they lack one feature of the MP3 players and streamers of old: visualizations! [mircemk] is a fan of those, and has built a hardware spectrum analyzer that pumps with the music.

The build relies on a 20×2 character VFD display that looks great, with high brightness and excellent contrast. It can be easily driven from a microcontroller, as it has a controller on board compatible with the typical HD44780 command set. On Arduino platforms, this means the display can easily be driven with the popular LiquidCrystal library.

The Arduino Nano inside takes in the audio signal via its analog inputs. It then processes the audio with the fix_fft library, which runs a Fast Fourier Transform in order to figure out the energy level of each frequency bin in the audio spectrum for both the left and right channels. This data is then sent to the screen for display. It’s impressively fast and smooth, with the display dancing along with the beat nicely as [mircemk] tests it out with some tunes.

If it looks familiar, it’s because it’s an updated version of a prior project from [mircemk]. We saw it previously as a VU meter that pulsed with the beat, an altogether simpler visualization but still a cool one. Video after the break.

Continue reading “Character VFD Becomes Spectrum Analyzer”

Big Audio Visualizer Pumps With The Music

A spectrum analyzer is a great way to create exciting visuals that pulse in time with music. [pyrograf] wanted a big one as a display piece, so set about whipping up something of their very own.

An ESP32 microcontroller serves as the heart of the build, with its high clock rate and dual cores making it a highly capable choice for the job. Audio from a microphone is amplified and pumped into the ESP32’s analog input. Core 0 on the ESP32 then runs a Fast Fourier Transform on the input audio in order to determine the energy in each frequency band. The results of this FFT are then passed to Core 1, which is used to calculate the required animations and pipe them out to a series of WS2812B LEDs.

Where this build really shines, though, is in the actual construction. Big chunks of acrylic serve as diffusers for the LEDs which light up each segment of the spectrum display. Combine the big pixel size with a nice smooth 30 Hz refresh rate on the LEDs, and the result is a rather large spectrum analyzer that really does look the business.

We’ve seen some similar builds over the years, too. Video after the break.

Continue reading “Big Audio Visualizer Pumps With The Music”

An Easy Music Visualizer With The Arduino Nano

Flashing LEDs are all well and good, but they’re even better if they can sync up with ambient sounds or music. [mircemk] has built the LUMAZOID visualizer to do just that, relying on some staple maker components to do so.

The build is open-source, and designed to work with strings of 60, 120, or 180 WS2812B LEDs. An Arduino Nano is charged with running the show, capturing audio via its analog-to-digital converter. A sensitivity pot enables the input level to be set appropriately.

From there, a Fast Fourier Transform is taken, providing data on the intensity of the audio in various frequency bins. The LUMAZOID can be set up to respond to just bass or to all frequencies as a whole. This data is then used to pulse the LEDs in time with the beat.

It’s a fun project that demonstrates the basic techniques required to build an audio-reactive visualizer. We’ve seen some other great builds in this space before, too. Video after the break.

Continue reading “An Easy Music Visualizer With The Arduino Nano”

LEDs display different pitches in a sunburst pattern

Spiral Music Visualization

Displaying notes live as they are being played can be a really powerful learning tool, but it’s usually used to learn how to play a specific instrument. This take on the topic is actually a neat way to learn more about music theory — how pitches work together to build the sounds that we hear. The visual tack chosen arranges each of 12 notes into a spiral. As you continue to go up the scale through more octaves, pitches that share the same name line up into a line like a ray projecting out from the sun. So there are 12 rays for the notes in the scale: C, C#/D♭, D, D#/E♭,F, etc.

[mechatronicsguy] built it a few years back but just now got around to documenting it, and we’re sure glad he did. The layout of notes at first looks just like a colorful visualization. But as he mentions in his description, this assigns a shape to each different type of cord. A major cord will have the same shape whether it is played with C, G#, B♭, or any other note as the root. The shape simply rotates around the axis based on that root note. Higher octaves will be shown further out on the radius, but the chord shape will still be the same. Minor, augmented, even modal chords and those with added pitches all have their own unique shape on the display.

You get the best understanding of the visualization by looking at the Python-rendered version in the video below. It’s a nice touch that notes turn grey and fade away after being released so you kind of see where the current chord came from. This isn’t strictly a perk of pre-recordings. While you can feed it MIDI files, you can also play a MIDI instrument and display the visuals live on the hardware version that uses a Teensy with an audio shield.

If you’re looking for examples on how music visualizers are used to teach the instrument, look no further than this Wurlitzer note visualizer replica. Also for those who don’t know, the song being played in the hardware demo (second video below) is Beethoven’s 7th Symphony. Well worth a full listen, it’ll change your life.

Continue reading “Spiral Music Visualization”

LED Spectrum Visualizer Driven By Raspberry Pi

Back in the 1980s, spectrum displays on audio equipment were absolutely must have, and the aesthetic came to define the era. This lingered on through the 1990s, and remains a cool look even to this day. [Arduino Guy] decided to put together such a display using a Raspberry Pi and a large LED display.

The LED display in question is of the 64×64 RGB type, available from Aliexpress and other electronics suppliers online. To run the display, an Adafruit RGB Matrix Hat is used with the Raspberry Pi 3B, which makes driving the panel a cinch. The visual effect is run via a Python script, which plays a wave file and produces the spectrum graphics via a Fast Fourier Transform.

While the code isn’t able to act as a general-purpose equalizer display for any content played on the Raspberry Pi, creating such a script could be an entertaining exercise for the reader. Alternatively, the Pi could be hooked up to a microphone to run the display based on ambient room noise. In any case, we’ve seen great projects like this before, such as this laser-based display. Video after the break.

Continue reading “LED Spectrum Visualizer Driven By Raspberry Pi”

It’s A TV-Scope-Guitar Amplifier!

Guitar amplifiers are a frequent project, and despite being little more than a simple audio amplifier on paper, they conceal a surprising quantity of variables in search of a particular sound. We’ve seen a lot of them, but never one quite like [Nate Croson]’s CRT TV guitar amplifier. The LM386 doesn’t just drive the speaker, he’s also using it to turn the TV into a crude oscilloscope to form a visualisation of the sound.

The video showing this feat is below the break, and it puts us in a quandary due to being short on technical information. He’s driving the horizontal coils with the TV’s 50 Hz sawtooth field timebase, and the vertical ones with the audio from the LM386. We aren’t sure whether he’s rotated the yoke or whether the connections have been swapped, but the result is certainly impressive.

So given that there’s not quite as much technical detail as we’d like, why has this project captured our interest? Because it serves as a reminder that a CRT TV is a bit more than a useless anachronism, it’s a complex analogue device with significant and unique hacking potential. The older ones in particular provide endless possibilities for modification and circuit bending, and make for a fascinating analogue playground at a very agreeable price. It’s worth pointing out however that some of the voltages involved can make them a hazardous prospect for the unwary hacker. If you’re interested though, take a look at our dive into an older model.

Continue reading “It’s A TV-Scope-Guitar Amplifier!”