On the 14th of January, 2022, the Hunga Tonga-Hunga Ha’apai volcano began a gigantic eruption that would go on to peak in ferocity the next day. The uninhabited island volcano would quickly make headlines as the country of Tonga was cut off the world and tsunamis bore out from the eurption zone.
In a volcanic event of this size, the effects can be felt around the world. With modern instruments, they can be properly understood too. Let’s take a look at how the effects of the Hunga Tonga eruption were captured and measured across the globe.
Far-Flung Effects
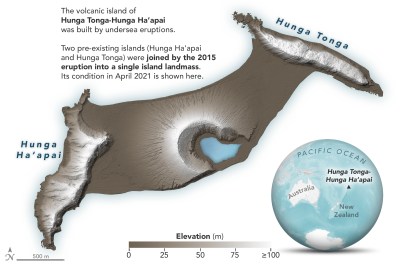
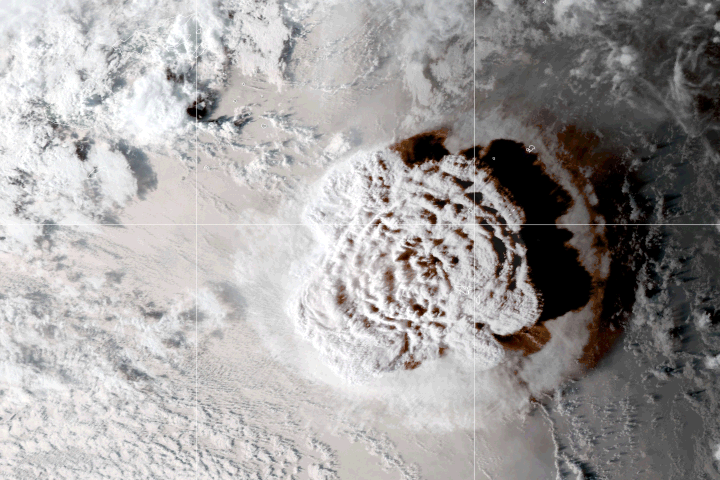
The Hunga Tonga-Hunga Ha’apai volcanic island that erupted in January bears two names because it was originally two separate islands that had become connected by volcanic activity back in 2015, so you know this is a geologically active region. However, the eruption this time was so ferociously powerful that the island was almost entirely destroyed, with satellite images taken in the aftermath shown only a small segment of high ground remains in the area.
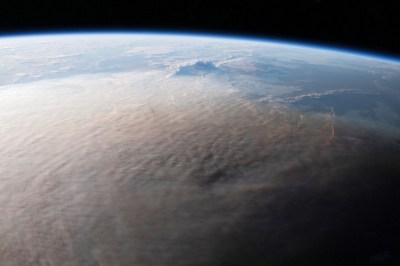
In the wake of the event, NASA reported that the eruption was hundreds of times more powerful than the atomic bomb dropped on Hiroshima in World War II, roughly the equivalent of 4-18 megatons of TNT. Ash was sent high into the atmsophere, potentially up to a height of 50 kilometers, to the point where the cloud could readily be photographed by astronauts on the ISS.
Sensors Everywhere
However, one needn’t have the instruments and infrastructure of a national space program to detect such a large event. One [Edward Jensen] reports that his own weather station in Phoenix, Arizona captured a pressure anomaly from the eruption, as did other amateur weather installations in the area. This could be dismissed as an anomaly, of course, but the data checks out.
In fact, with pressure altimeter readings from national meteorological networks collated by [Daryl Herzmann], one can clearly see the pressure wave from the eruption passing over the continental United States on the afternoon of January 15. The National Weather Service also concurs with their own analysis, showing how the pressure wave reached stations as far-flung as Salt Lake City, Utah and Glasgow, Montana. Effects weren’t just seen in wiggling graphs of weather data either; the volcano was credited with lifting the fog in Seattle as the pressure wave passed by.
Distributed networks of sensors are particularly useful for tracking events like these; we’ve attempted to use similar methods ourselves to investigate nuclear incidents, albeit without success. Incidentally, though, the powerful blast of the Hunga Tonga eruption was picked up at all 53 infrasound monitoring stations maintained by the Comprehensive Nuclear Test Ban Treaty Organisation, highlighting that the event really was on the scale of a nuclear detonation.
Earthquake sensors were able to pick up the rumblings from the eruption, as you’d expect. The US Geological Survey released images on Twitter showing how seismographs at Mount Hood, Oregon recorded the event. Meanwhile, tsunami warning systems were triggered around the Pacific. Studies suggest that while tusnami waves were detected on many shores far from Tonga itself, such as in Peru and Japan, these were likely generated by the interaction of the atmospheric pressure wave with the water, rather than being generated by earthquake events themselves.
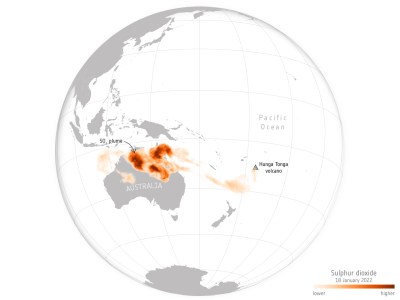
Outside of the waves from the event, other lingering effects from the volcanic activity have spread around the world. The Copernicus Sentinel-5P mission captured a giant sulfur dioxide plume from the eruption which had floated its way over to Australia by the 18th of January. The satellite is dedicated to pollution monitoring, and is designed to track aerosols and trace gases in the atmosphere. Thus, it was the perfect tool for monitoring the progression of the gas cloud as it travelled 7000 km in just a few short days after the eruption.
Did You Hear That?
Perhaps most amazing, though, are the reports that the volcanic event could be heard as far away as Alaska, almost 10,000 km from the epicenter of the eruption. In a report from Alaska Public, residents talk about being woken on Saturday morning to loud booming noises. Travelling at the speed of sound – around 1225 km/h at sea level – the noises were heard around eight hours after the eruption kicked off.
For an eruption like this, detectable on a global scale, the Hunga Tonga event wasn’t nearly as bad as it would have been if the island were inhabited. Sadly, still five deaths and eighteen injuries have been reported in the aftermath, with many still missing. Communications were cut due to a damaged undersea cable, and ash covered much of the surrounding area. Thankfully, aid was quickly deployed from surrounding countries.
Being forewarned would be better than cleaning up after the fact, though, and volcano eruption prediction is still an open research question. The hope is that data gathered in situations like these will better educate us and help us better mitigate the damage from similar events in future.
[Banner image: NASA Earth Observatory footage. Go check out their animated GIF!]


The event was also observed with relatively inexpensive citizen-sciene infrasound sensors like the “Raspberry BOOM” (by the same company that makes the “Raspberry Shake” citizen science seismometers). A discussion can be found in the community forum https://community.raspberryshake.org/t/tonga-volcano-jan-15-2022/2642/9 , but as the data is public and archived, you can also go back in time and visualize the data from any of the stations in that network and see how the infrasound rumbling (that lasted for more than half an hour) travels around the world ==> https://stationview.raspberryshake.org (use the filter icon in the lower left corner to display only the infrasound stations, then click on a station and inspect the data via “24 hrs plot” link ).
My own Raspberry Boom (in Germany, almost at max distance from the event) is rather carelessly hosted indoors and was still able to pick up the rumble (twice, for the wavefronts that travelled in the north-west and south-east directions resp. to reach Germany). Putting it outside (like you should for best results) requires to build a mechanical “wind filter” from air ducts that combined cancel out low frequency wind noise from any direction, a great project for makers. Other than once-in-a-century volcanic eruptions and hopefully-never-again-to-happen atmospheric Mega-Ton TNT equivalent nuclear explosions, there is not that much to be picked up in infrasound tho, but meteors can be observed as well.
That’s fascinating, thank you for sharing this information!😃👍
Such a network reminds a little bit of the amateur weather stations that can be seen on a map in APRS networks (amateur radio/cb radio). Makes me wonder if seismographs/meters could be included in APRS, too.
I wonder how big the effect is at the antipode.
Don’t forget that this eruption was exceptionally fast (<10min) and powerful due to the amount of water vaporized from the caldera collapse.
My BME280 sensors detected it as well. In the graphs there is a notable peak followed by a dip. Nicely graphed in my home automation system.
Jep mine also. When I show people the pic I took they have trouble believing me :-) around 20:00 ?
The “albeit without success” link points at a wordpress edit page. Was this the intended link target?:
https://hackaday.com/2019/08/28/global-radiation-montoring-and-tracking-nuclear-disasters-at-home/
Thank you!
Some sources in South Africa reports 2 waves with second one coming from other direction which proves existence of the dome. Checkmate spheroidians!
;)
You need to look up the works of Cyrus Teed.
https://en.wikipedia.org/wiki/Cyrus_Teed
Thanks! This is so legit!
“posits the Earth and sky exist inside the inner surface of a sphere”
Makes perfect sense! This is why your shoe soles wear at toes and heels. If we were walking on the sphere they would wear in the middle! :)
Jokes aside – I have red recently nice article about this pressure wave misunderstanding related to the fact that we got used to flat map representation of earth. A fake news about returning wave was first thing that came to my mind.
Would be a nice mathematical exercise to make a flat map (mercator?) simulation of the wave propagation as an animation.
Yes, I have detected the second wave as well here in Europe.
Any way to estimate the noise level in dB at ground zero of volcano? If it was loud enough to be heard half way around the world, I’d imagine it’d be unusually high on dB scale.
My weather station (east coast of Australia) showed an upwards spike in air pressure 3 hours after the eruption. Half an hour later there was a similar sized downward spike. Other owners of the same weather station (Ecowitt) reported exactly the same pattern, albeit at different times and different locations around the globe.