The CPU is the part of the computer that makes everything else tick. While GPUs have increasingly become a key part of overall system performance, we still find ourselves wanting to know how our CPU is doing. CoreFreq is a Linux tool that aims to tell you everything you want to know about your modern 64-bit CPU.
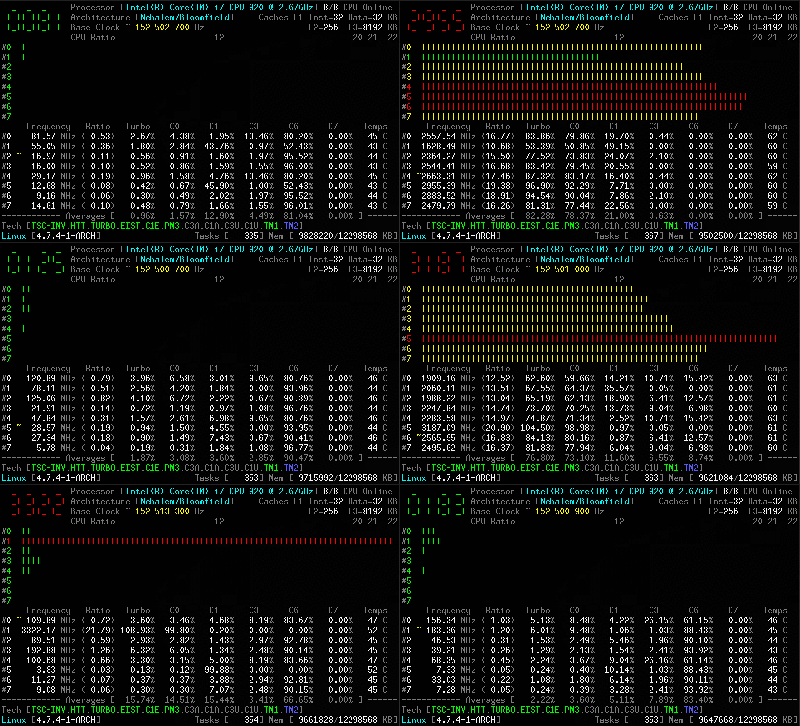 The tool relies on a kernel module, and is coded primarily in C, with some assembly code used to measure performance as accurately as possible. It’s capable of reporting everything from core frequencies to details on hyper-threading and turbo boost operation. Other performance reports include information on instructions per cycle or instructions per second, and of course, all the thermal monitoring data you could ask for. It all runs in the terminal, which helps keep overheads low.
The hardcore among us can build it from source, available on GitHub, though it’s reportedly available in package form, and as a live CD, too. We could imagine data captured from CoreFreq could be used for some fun performance visualizations, too. If you’ve been whipping up your own nifty command-line tools, be sure to drop us a line!





be sure to take a look at turbostat(8) as well (installed from the kernel tools/ directory).
Recent versions of htop have the option to display core frequencies in the load bars too.
I love htop but I instantly noticed C-states stats in this tool. Very cool feature!
Help deal with USB disconnect/reconnect.
https://www.pcmag.com/news/amd-offers-tips-to-mitigate-usb-disconnect-problems-on-b550-x570-motherboards
i7z is also great for getting CPU freq.
How do CoreFreq, htop, and i7z relate to powertop? Honestly curious… I’ve only used powertop.
top is a process monitor, htop is a fancier version of that. turbostat (and i7z) is a CPU frequency monitor, CoreFreq appears to be a fancier version of that. powertop is a power consumption monitor. There is a little overlap between these tools in some cases (especially the fancier ones), but they each have a different primary function.
Amazing, this is a joy :-)
i remember when i was 17 i was in a summer program where i got to write parallel software and test it on an 8-processor SGI MIPS R8000 “super computer”. i would hit enter and then run upstairs to look through a glass window into the sacred hall where it was kept, and i could watch an LCD on the front panel with a CPU utilization bargraph just like this. i would see the 2 or 4 processors that i was using pegged at 100%, and hopefully only a little idle churn on the other ones. it was so cool!
in the same era, my home PC had an 8-segment LED on the front panel that was supposed to display the CPU speed (it had jumpers on the back), which i had attached to the LPT port. and a program “portato” that flashed the lights for disk, network, CPU usage, etc. i still remember the “.” was swapping, that was something to know about! i always was watching that thing, and trying to know everything going on on my computer. especially because i very often really did want to know “why is this so slow now?”
now i have gotten in the habit of buying just about the cheapest desktop processor, and even so, i have 4 cores and i don’t ever care what’s running on them…it’s hardly even worth looking at top(1) when it bogs down, because i already know the problem is usually just enough storage writes to trigger the SMR tax. sigh. nothing’s exciting anymore.