You’ve generated a ton of data. How do you analyze it and present it? Sure, you can use a spreadsheet. Or break out some programming tools. Or try LabPlot. Sure, it is sort of like a spreadsheet. But it does more. It has object management features, worksheets like a Juypter notebook, and a software development kit, in case it doesn’t do what you want out of the box.
The program is made to deal with very large data sets. There are tons of output options, including the usual line plots, histograms, and more exotic things like Q-Q plots. You can have hierarchies of spreadsheets (for example, a child spreadsheet can compute statistics about a parent spreadsheet). There are tons of regression analysis tools, likelihood estimation, and numerical integration and differentiation built in.
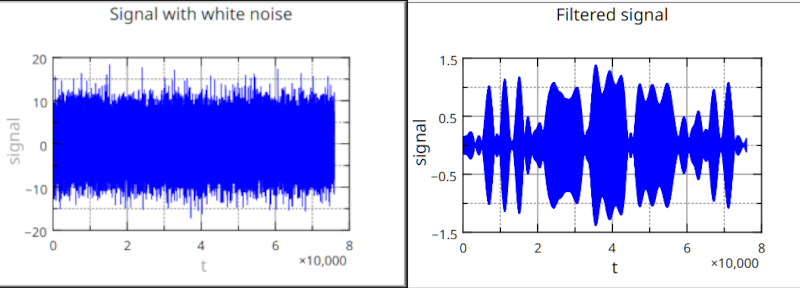
Fourier transforms and filters? Of course. The title graphic shows the program pulling SOS out of the noise using signal processing techniques. It also works as a front end for programs ranging from Python and Julia, to Scilab and Octave, to name a few. If you insist, it can read Jupyter projects, too. A lot of features? That’s not even a start. For example, you can input an image file of a plot and extract data from it. It is an impressive piece of software.
A good way to get the flavor of it is to watch one of the many videos on the YouTube channel (you can see one below). Or, since you can download it for Windows, Mac, Linux, FreeBSD, or Haiku, just grab it and try it out.
If you’ve been putting off Jupyter notebooks, this might be your excuse to skip them. If you think spreadsheets are just fine for processing signals and other big sets, you aren’t wrong. But it sure is hard.


MATLAB.
Why would you reinvent the wheel?
matlab is paid for
This ^^^
100%
There are also data acquisition systems out there that come with excellent software.
I’m too stingy to pay for it. Plus with python you can work with networking, get data from a serial port, and do whatever.
Octave:
https://octave.org/
Largely compatible with MATLAB and you can call Python code from it.
Came here for this comment, Octave rocks, thank you GNU.
You want a wheel? Well use the one we all do! Sure, it will cost money. Sure, you have to spend ages learning how to use it. Sure, it routinely stabs you in the throat. But we’re stuck in the walled garden and cannot leave, and we need company!
Matlab has its down sides but the value it adds for the price is honestly very reasonable. You need every RF encoding scheme known to man. Here it is it will just work. You need every image processing concept you can think of no problem I got you. Matlab is not perfect but there is a reason so much industry still uses it, speed of development.
I was going to write something about the cost of Matlab, vs. the amount of times I would use it, being a hobbyist.
But I found that they only charge 119 euro for a perpetual license for personal/home use.
And I find that such a surprisingly reasonable license that I now have no arguments left anymore.
The only limitation is that you can’t buy certain add-on products, but in reality that’s no limitation. By the time you need those add-on products, you’ve already wandered into the realms of a professional.
Why bother with matlab or octave if you are a hobbyist? Python with scipy is going to be a more useful tool that doesn’t cost anything. Of course, if you are already used to matlab professioanally, you probably don’t even need a home license as you could use your commercial license.
I’m a very advanced hobbyist, having a BSc in Computer Science. :) In my daily work-life, I am software engineer. But in my free time I like to keep my electronics engineering skills up-to-date. If Matlab is being used by millions of engineers, that means that I feel I have to check out what al the hubbub is and learn how it works.
Learning new things fulfills my endless curiosity. Unlearning things is what costs me the most effort. ;)
Plus the fact that Python is annoying and matplotlib etc. are poorly documented and difficult to use.
“Im a very advanced hobbyist … In my daily work-life, I am software engineer.”
Then you need to explore a product that is both free to use, Open Source, and developed by IBM software engineers: it will run on a Raspberry Pi to a supercomputer.
https://nodered.org/
Agree – mostly.
Some time ago I had to do some drawings – usually didn’t do them so I had no access to AutoCAD on my workstation. Boss told me to go to other office and every time they have one PC free I could use it. I just asked IT to install QElectrotech for me – no licencing problems and I could later sketch any drawing I needed.
So next time I need Matlab and will not get it I will use Octave/Scilab.
I am not encouraging you to switch or even learn other tools. Just my point of view is to not repeat at hobby level what I do at work:)
Also AI is your friend. Working for a stingy boss we have to program our own libraries. chatGPT is great in producing a 90% solution, so the function you need is maybe one hour away with testing and debugging.
“Working for a stingy boss we have to program our own libraries.”
What a waste of engineering time.
Most “big” companies actually mandate home-grown libraries to avoid use of (library) code that does not offer legal protection in the event of “software defects.”
Coders can make mistakes but lawyers can screw up everything.
i really want to know the answer to this question. matlab is expensive, but jupyter and octave are free. what does this do differently?
out of curiosity, i installed octave. i had mixed feelings about its decision to default to a commandline / TUI sort of environment, given that it doesn’t just use readline, but attempts a lot of awkward matlab-esque features like interactive paren matching. anyways, i didn’t read any of its documentation and i could not get it to do anything neat by just poking around blindly.
i also tried jupyter. i like that it forced a tutorial on me, but i didn’t read the tutorial and i didn’t get it to do anything either. :)
which all closely mirrors my experience with matlab…i did use it, 25 years ago. i had a couple classes that featured one or two lectures specifically on how to use it. but i always found it kind of clunky and (for my purposes) not worthwhile. for the problems i threw at it, it was easier to dig around in the table of integrals at the back of the calculus text book than to dig around in matlab’s interactive help feature.
these days, i mostly do math in a plain text file, gnuplot, and pen and paper (in that order, depending on the difficulty of the problem). for data analysis, i typically use gnuplot, perl, and C (again, in that order).
i guess i’m just not that advanced a user. or really, i’m more willing to spend a lot of time running into problems i understand (my poor algebraic factoring skills, for example) than ones i don’t.
but what’s special about labplot? it’s more focused on data than on math? it’s more performant on big datasets? it’s pointless ‘me too’ entrant? i don’t know from this article. the article says i should learn it instead of jupyter, but doesn’t even imply a reason why.
I dunno what Matlab looked like 25 years ago, but the modern versions are very polished and easy to use. Tons of documentation, useful error messages, and just a heap of functionality across all the different toolkits (for a price, of course). I used it all throughout undergrad, grad, and a bit at work. To save money, I’ve tried moving away from it over the past couple years and have used Python and Octave as replacements. Both offer a lot of functionality, for free; but, compared to them, Matlab is just faster to work with, more robust in features, and overall involves noticeably less friction for my applications, which are mostly setting up and running Monte Carlo sims and processing big arrays of data.
Matlab/Simulink is also very nice for solving problems and making simulations involving differentials, which is pretty much any dynamic mechanical problem you might think of. With a simple serial IO block, it’s trivial to interface with some arduino project and even run some real time control algorithms. Say, a robot arm and its “digital twin” on the computer.
Is there any open source equivalent even close to matching in functionality? I know scilab had something similar, but I couldn’t get it to work the last time I tried.
Scilab had Scicos or Xcos – I don’t remember. You could combine all with RTAI and get real time system. I did something like this 20 years ago as a starting point for replacing matlab and xpc target for other students. No one continued :) It was my first real experience with Linux.
i think this is a great example of different strokes different folks.
when i used Matlab, i was interested in its ability to manipulate symbolic algebra. which, as i dimly recall, seemed like a clunky afterthought to its core data manipulation functionlaity (“matrix”). i vaguely remember liking Maple better because it was opposite — symbolic math first, data second. but i never really learned Maple either. anyways, i just poked around at octave and i can assert firmly, octave’s symbolic algebra functionality is a clunky afterthought — a plugin that wraps the “sympy” library. which isn’t to say it isn’t useful if you learn how to use it!
the one time i did monte carlo approximation, i used C. and processing big arrays, usually C or perl. sometimes i use the GNU mp (multi-precision) libraries to get more precision than IEEE 64-bit float, which i imagine any real math software would do more seamlessly.
i’ve been known to process big arrays with sed and dc. so to me, these are tools i already know for other purposes. and no matter how slick matlab is, it’s going to seem unfamiliar to me by comparison.
these days, i half expect people doing that sort of work to use R. there’s so many to chose from! so i still don’t know how labplot fits into this :)
LabPlot is more of an excel competitor than a octave/matlab/jupyter clone. It has a GUI spreadsheet workflow with operations (and plots) you can do on columns. I used it for some uni projects, it’s great if you need to plot tons of data and don’t need the hyperfine control of code (and remembering what commands you used to set the axes to log-log and ticks to powers of 2 again)
It’s much faster than libreoffice or excel (tens of thousands of lines of CSV, maybe more, processed instantly) and has much more comfortable UI for messing with the plots. It keeps everything self contained in one neat file. There are features for reading out precise values from the plot, quite intuitive UI for equation fits. And it’s a nice FOSS app that’s right there in your package manager on all major OSes and needs zero setup.
Regardless of price, I find MATLAB’s graphing commands very unintuitive. Especially how they do totally different things depending on number of arguments.
I haven’t tried Labplot yet but the GUI looks nice.
Proprietary and not free. Enough reasons to steer away
I wonder if Matlab can control and read data from my Siglent oscilloscope through the USB interface, like Siglent’s own EasyScopeX software. That would be cool.
I wonder the same about LabPlot. ;)
you can interface matlab with python and use all the python functions out there. Did this to set up a demonstrator for OPD-UA-Interface and worked like a charm.
I control my Siglent from Python using pyvisa. It’s just a thin wrapper for the VISA language, which is crappy (the standard defines exactly one command), but it does everything.
The good thing is that it works through both USB and network.
No idea, but if I had Siglent scope, I would definitely check out ngScopeClient first.
R programming language, with the R Studio frontend, has always been my first choice for these kinds of tasks. I’ve never used MATLAB or Octave, and haven’t made much use of python’s graphing libraries, but everything I hear suggests R Studio gives pretty similar capabilities to those options too.
I don’t know what the fuss is about. I find Excel to be sufficient for all my data analysis and graphing needs.
cool
I don’t do much data processing – that is why at work I use excell for it. Some time ago I received a 500MB TSV file. It took excel some time to open it but any processing was very slow. For me not a bottle neck – for others it might be hell.
Things also change when you need to do this analysis live and interface results to some devices or other software.
If it is as easy to use as it is to download, I would not try it.
I use veusz for this. This would be my choice.
Obviously, Nobody seems to know it.
Check Out veusz
https://veusz.github.io/