If you are used to coding with almost any modern tool except the Arduino IDE, you are probably accustomed to having on-chip debugging. Sometimes having that visibility inside the code makes all the difference for squashing bugs. But for the Arduino, most of us resort to just printing print statements in our code to observe behavior. When the code works, we take the print statements out. [JoaoLopesF] wanted something better. So he created an Arduino library and a desktop application that lets you have a little better window into your program’s execution.
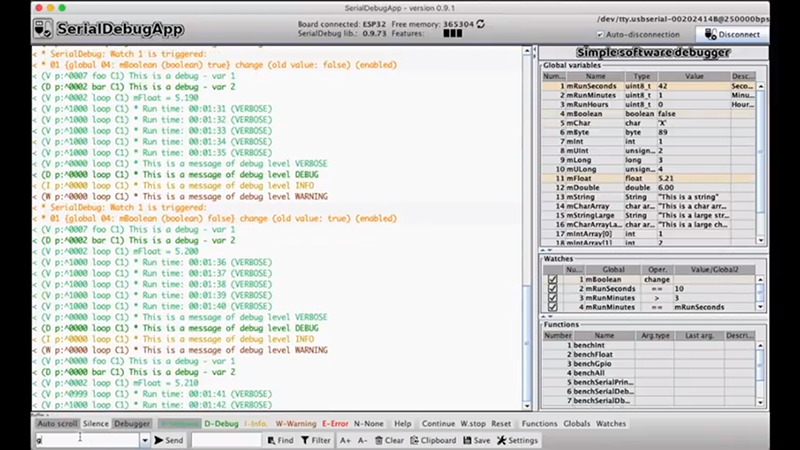
To be honest, it isn’t really a debugger in the way you normally think of it. But it does offer several nice features. The most rudimentary is to provide levels of messaging so you can filter out messages you don’t care about. This is sort of like a server’s log severity system. Some messages are warnings and some are informational, and some are verbose. You can select what messages to see.
In addition, the library timestamps the messages so you can tell how much time elapsed between messages and what function you were in during the message. It can also examine and set global variables that you preconfigure and set watches on variables. It is also possible to call functions from the serial monitor.
There’s a companion Java program (see video below) although you can use most of the features directly from the normal serial monitor, it just isn’t as pretty. The Java program can also read an Arduino program file and convert all the print calls in it to use the library, if you like.
As you might expect, this requires some cooperation from your program. You have to set up the library and the serial port. You also have to arrange for the main function to run frequently (for example, in the main loop). By default, the debugging is mostly suppressed (although you can change that). You have to issue a serial port command to turn on higher level logging and debug functions.
If you start with the examples that come with the library (use the simple one for an AVR-based Arduino and the advanced one for any others), you’ll see a few #defines you can use to control the library:
- DEBUG_DISABLED – Set to true and the library compiles out with no overhead
- DEBUG_DISABLE_DEBUGGER – Turn off everything but message logging
- DEBUG_INITIAL_LEVEL – Starting level of debug messages
- DEBUG_USE_FLASH_F – Store debug messages in flash memory
There’s really two versions of the code: one for 8-bit AVR processors and another for other Arduino types. We found problems building both of them. The files src/utility/Fields.cpp, src/utility/Vector.h, and
src/utility/Util.cpp refer to arduino.h. That works on computers that have case-insensitive file systems. In each case, for Linux, it needs to be Arduino.h. In addition, SerialDebug.cpp is lacking a stdarg.h include. We’ve reported both of these issues to the developer so they may be fixed by now.
You can explore the video and the documentation to see how it all works. Is it a full-blown debugger? No. You can’t stop execution (odd, because you certainly could technically), set breakpoints, or single step. But it still useful to have access to at least some of your program’s internal state.
Of course, Arduino has promised full debugging soon. We’ve even seen one Arduino debugging another via debugWIRE.


That looks AWESOME! Thanks for making it.
I’m sure you realize it, but we are just reporting on it. The author is [JoaoLopesF].
But original authors sometimes read the comments, if they dare :-D
Double Dog Dare!
B^)
I wonder if the future Arduino IDE debugger is for the bigger MCUs and not for AVRs. I couldn’t find any information.
AVR hardware debugger is not going to happen as they are still messing with the Reset pin (used by hardware debug). It seems to be a deliberate decision for their walled garden approach.
Why bother with their crippled IDE when there are proper tools out there for their ARM variants? It is not like their is a lack of FOSS tool chains and IDE. No amount of their customized IDE can abstracted and “protected” the users from exposing the complexity of a full hardware debugger without getting in the way.
Calling Arduino a “walled garden” is a bit of a stretch…
Are there any IDEs that are as simple to use?
VS-Code with PlatformIO
Personally i’ve managed with the AVR arduinos so far. I’ve been thinking to transitioning to ESPs though, especially since i have couple of project ideas, where i could use wifi. I have couple ARM boards, MIPS boards (Chipkit) and other 8-bitters, but i haven’t needed them for anything.
Professionally i do other kind of programming and i do wish i had the same tools i have there (on some platforms), but it is what it is. I can manage.
It looks cool and would certainly be welcome. I haven’t looked at the code yet but can imagine it. My guess is it’s going to be fairly large framework. I regularly run into Arduino size limits already. I dunno cool but seems like allot to ask of the micro on top.
I regularly run into space limitations and have restrict my PRINT statements to a few at a time, strategically placed. Having a framework in place seems like it can only make a space problem worse. Another comment related to the timing problem that PRINT statements have which is absolutely true. As challenging as debugging on the Arduino can be, faciitating PRINT doesn’t seem to be solution. My solution these days tends to involve stray pins, and using them as signals I can pick up a logic analyzer. I can tell when the code enters or exits a routine, maybe print out a strategic message here and there… Once a function is debugged, I’d remove the pin and print code and work on another section. It can be tedious but without an actual debugger, that’s how it is on a tiny chip.
In theory, it should be possible to write some kind of tiny OS for the Cortex-M3 based Arduinos (e.g. Arduino Due), which lets the sketch run in unprivileged mode and uses the hardware debug features of the platform to debug the sketch. It could communicate with a PC via USB (possibly emulating a gdbserver). This would allow you to debug an uncooperative sketch, even one that would crash the controller by trapping exceptions and basically work similar to how you debug ordinary linux applications. If done properly, it should behave like a proper JTAG/SWD debugger, just slower, without additional hardware. I wonder whether there would be enough interest to implement such a thing, possibly as FOSS.
Kind of missing the whole point of SWD and putting in more code that could go wrong or interact with your code.
– It is done in the background hardware and not affect your sensitive timing.
– You can still look at and change the internal peripheral settings, variables, set hardware breakpoints.
– It works even when your firmware completely crash to an exception handler or messed up stack. You can see the pending IRQ or exceptions and look at the call stack.
If you are working with peripherals at register level, chances are that crashes ca happen a lot. e.g. forgot to turn on clock on peripheral block or run away IRQ/DMA. You are much better off ditching the environment and use the proper IDE with SWD support. Their software frame work (if you chose to use it) is independent from their crippled IDE.
Sure, SWD is by far superior, but requires additional hardware, which Arduino users seem to dislike, since it seems to be rarely used. If done correctly, such a self-debugging capability would be able to access peripherals as well and use hardware breakpoints. By carefully using the ARM privilege modes, MPU and exceptions, the sketch could be prevented from crashing the self-debugging software, much like a linux application can’t crash the kernel, allowing you to examine the stack and registers. By trapping accesses to the USB, NVIC, SCS, debug and clock control registers, you could also prevent the sketch from (accidentally) interfering with the self-debuggers communication.
I’m a little surprised there isn’t an Arduino simulator-type thing, akin to the iOS or Android simulators for their respective IDEs.
There are CPU simulators, but simulation of peripherals is generally incomplete. And then simulating hardware around it is… difficult.
There is this paid schematic simulator that can do a whole bunch of these things:
https://www.labcenter.com/simulation/
There must be more of them.
You could just use simAVR for this.
There’s SimulIDE and Tinkercad you can use for simulation. I’ve tried some simple stuff, but not any complex periphrelas like LCDs etc though.
https://hackaday.com/2018/08/22/simulate-pic-and-arduino-avr-designs-with-no-cloud/
If you are a Visual Studio user, Visual Micro is a great option that gives you a lot of nice debugging features. Plus it gives you intellisense and other features you expect with a modern IDE. http://www.visualmicro.com
Came here to recommend this.
Been working with Visual Micro for around 3 years now – excellent tool and the authors are very helpful.
I’m a fan of VisualMicro as well.
Amen!
I’ve been using Visual Micro for Arduino projects for years. Not only do they offer a debugger in the paid version (which I must admit I haven’t needed so far), but all the key combinations for Visual studio that I use all day, work as expected, code highlighting also works the same, and best of all: other plugins for Visual Studio work just as well for Arduino development. For example I use WholeTomato VisualAssistX for my work all the time, to help me quickly navigate large projects of code, and it works while I have an Arduino project open too.
Also, the serial terminal that’s built into Visual Micro is much better than the one in the Arduino GUI. It knows how to disconnect while the chip is programmed, and to reconnect when the programming is done.
Highly recommended!
Hi, @Al Williams,
I am the author of SerialDebug library,
and I very happy with your post, very good post.
This is something that motivates anyone who makes open source code, like me.
Thanks a lot.
Hmmm. The linked article that “Arduino has promised full debugging soon” was publised on Hackaday on May 18th and reported hearing from Fabio Violante, CEO of Arduino, and Massimo Banzi, Co-founder of Arduino that “There’s going to be an update to the Arduino IDE soon, and real debugging is coming to the Arduino ecosystem”
So this still has not happened.
Debugging is challenging even with the best debugging tools and tool support. With no reasonably accessible hardware and tooling to help beginners debug their code, doesn’t this make the Arduino a very bad choice for beginner enthusiasts?