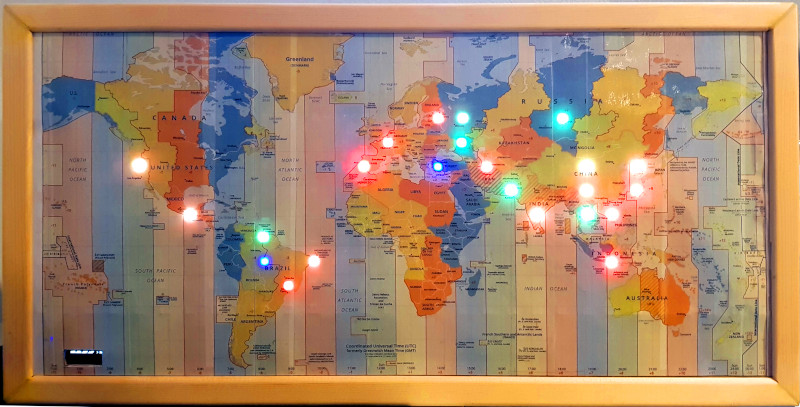
It has never been easier to build displays for custom data visualization than it is right now. I just finished one for my office — as a security researcher I wanted a physical map that will show me from where on the planet my server is being attacked. But the same fabrication techniques, hardware, and network resources can be put to work for just about any other purpose. If you’re new to hardware, this is an easy to follow guide. If you’re new to server-side code, maybe you’ll find it equally interesting.
I used an ESP8266 module with a small 128×32 pixel OLED display connected via an SSD1306 controller. The map itself doesn’t have to be very accurate, roughly knowing the country would suffice, as it was more a decorative piece than a functional one. It’s a good excuse to put the 5 meter WS2812B LED strip I had on the shelf to use.
 The project itself can be roughly divided into 3 parts:
- Physical and hardware build
- ESP8266 firmware
- Server-side code
It’s a relatively simple build that one can do over a weekend. It mashes together LED strips, ESP8266 wifi, OLED displays, server-side code, python, geoip location, scapy, and so on… you know, fun stuff.
The Hardware
First of all, you need a map. Obvious, right? But your map type choosing can be an important part of the project and can greatly simplify or complicate the whole setup. The issue here is the map projection type. There are many map projection types and some are more straightforward to use on this project than others. The ideal one is the equirectangular projection where latitude and longitude can be mapped in a linear fashion. I used the timezone map from the CIA because, well, it’s kind of cool. But it’s not ideal, since it seems to be a Mercator projection variation (without the poles) hence the latitude increments are not the same everywhere as the map area gets exaggerated near the poles.
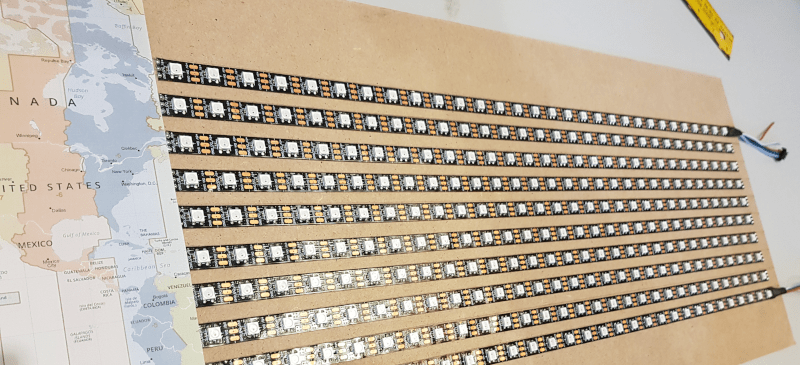
I used two standard A4 sheets for a 50cm by 24cm map. The LEDs go behind the sheets, so the thickness of the paper is important if you want the lights to really stand out. I had 5 meters of LED strip with a spacing around 16mm that I cut into 10 individual strips. I positioned each strip to match the LED spacing so I have a perfect grid. This covers the full longitude range and latitudes between 65 and -35. It’s not perfect but likely covers around 95% of the internet connected world. It’s a compromise.
I choose to power the LED strip straight from the ESP8266 5V pin of the board, powered from the USB cable. It’s 300 LEDs in total and I was pretty sure that, even without doing the math, it would definitely not work. When I was prototyping, I tried that anyway and to my surprise, more than half the LEDs still lit. I figured that if I need all LEDs on than I had bigger problems to deal with because then my server would be under heavy attack! At least, that’s what I told myself as an excuse for being too lazy to add a decent power supply (and more wires). If you’re making a display that uses many of the pixels at one time, you need to use an external power supply.
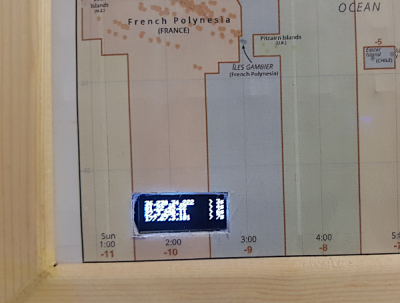 In the end, I cut a small rectangular hole in the map so I can see the OLED screen with the last 4 IPs that were recently active. It kills a bit of the retro style but curiosity took the best of me. This was after all was done, so the hole looks really crappy.
Tip: LED strips are great, with only 3 wires, VCC, GND and DATA and each pixel is individually addressed. The DATA line is also directional, if you are cutting and soldering them to make a board, be carefull not to change the direction of the DATA line. Doing so will cause that strip, and all subsequent ones, to stop working. Just saying, it’s not that I was distracted and did that in the first try… (I was, I did…)
The Firmware
The ESP8266 programming was not very complicated. The setup initializes the WiFi, the OLED and the LED strips. The main loop pools the server periodically for latest IPs and geolocation and then translates that data into a particular LED with a color that relates to the time elapsed since that IP address was seen by the server, like a heat map by time. Starts red, fades to orange, yellow, green and blue until it disappears after 10 minutes.
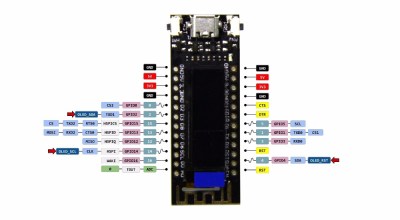
The LED strip library used was NeoPixelBus and it’s worth mentioning that there are some limitations for the 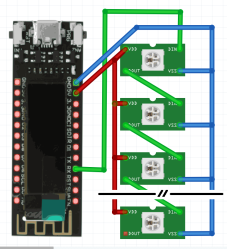 ESP8266. The ESP8266 requires hardware support to be able to send the data to the LED strip. Due to this and the restrictions on which pins are used by each hardware peripheral, our only options are GPIO1, GPIO2, or GPIO3. The most reliable seems to be GPIO3 for DMA supported operation, unfortunately this is also RDX0. The normal feature of this pin is the serial receive hence using this DMA method will not allow you to receive serial data. For this project that’s not an issue but it’s worth noting.
The OLED library used was Adafruit_SSD1306. This ESP8266 module documentation is not great and it took some time to figure out how to make it work. The ‘secret’, besides mapping the proper SDA, SCL and reset lines, is to call the Wire.begin() function in the setup before initializing the Adafruit library.
#define OLED_RESET 4
#define OLED_SDA 2
#define OLED_SCL 14

void setup()
{
//OVERRIDE Wire.begin from Adafruit_SSD1306 to make this work on ESP8266 TTGO OLED
Wire.begin( OLED_SDA, OLED_SCL);
...
The Server-Side
The server-side code was made in python, using python-geoip geolite2 and scapy libraries. Scapy is a really great tool and library. If you’re into network testing, in particular pentesting, you probably know it. If you are not, Scapy is a packet manipulation tool written in Python by Philippe Biondi. It can forge or decode packets, send them on the wire, capture them, and match requests and replies. It can also handle tasks like scanning, tracerouting, probing, unit tests, attacks, and network discovery. Netcat has been dubbed the “TCP/IP swiss army knife”, Scapy is like that but for packets.
To start sniffing traffic one can do:
def custom_action(packet):
 srcip = packet[0][1].src
 gps = geolite2.lookup(srcip) ...

sniff(filter="ip", prn=custom_action, count=128)
This tells Scapy to sniff for IP traffic and, for each packet, run the custom action. In this example it will use the geolite2 library to lookup the IP. The python-geoip-geolite2 package includes GeoLite2 data created by MaxMind and its use is pretty straightforward. Since the GeoLite2 database is local, there is no need for the server to make outside requests to identify the IP location. (it’s also not very accurate, better options do exist). Filtering IP traffic is not enough to identify attacks, legitimate traffic also appears. The server is private, so let’s just say a big part of it is “unwanted” traffic. If we wanted to take it further, we could connect the map to our favorite NIDS. But then again, this was a weekend project…
I also used the SimpleHTTPServer package to set up a webserver on a custom port so that the ESP8266 can connect to it and fetch the latest results, since they are regularly written to a file. To use a different port other than 80, one should use a handler, like so:
Handler = SimpleHTTPServer.SimpleHTTPRequestHandler
httpd = SocketServer.TCPServer(("", PORT), Handler)
httpd.serve_forever()
This will create an HTTP open port at PORT and serve whatever files are in the current directory where the python code is called. This is, of course, not very safe from a security perspective.
The Results
In the end I was happy with the results. I took a lot of shortcuts and simplifications but hey, it’s a hack. There are many things to improve if I ever get to do version 2, which is clearly on my mind and involves an entire wall. Now, you can say that for the accuracy and resolution, an LCD screen is clearly much better. And it’s true. But maybe it’s not as fun. I usually ask myself how can I do XYZ project, and not why. That’s how I end up with the workshop full of stuff and a bunch of, let’s be honest, pretty much useless projects.
My take away is the enjoyment I get from making them and what I learn along the way. And there’s a blinking lights bonus in this one. Here’s a time-lapse of around 6 mins (1 sec per frame):
I fondly call China “the permanent light show”. The full source code for both firmware and server side can be found at GitHub, just in case you want to try it yourself and improve on it.
If this project isn’t your thing, don’t worry, we covered a lot of different and interesting other led strip projects in the past too.


Nice,
I got me thinking,
put a paper World Map over the face of a large screen television (some are going cheap nowadays) and display dots on the screen through one of the data ports to glow through the paper.
Don’t use the paper at all…
yeah, kind of redundant there. I wont razz you for it though cause I’ve come up with dumber ideas. :)
Too simple!
It should use bibble to send data to babble which uses the booble framework, dependant on the frabble architecture, which is built on the droble backend, and uses a frooble to process data so puffle can interact with druffle to fluffle the socksifier.
If the ESP8266 doesn’t depend on dozens of services, running on hundreds of servers, exfiltrating user data all over the place, it’s just a trivial project.
LOL !!!!
Bill Gates has the BEST reply so far !!!!
Hi Bill,
Thanks for your input, I really appreciate it.
I actually tried to use the booble framework for the IoT but was afraid that it would blockchain my AI algoritm. Furthermore, I think there’s a big data startup already working on that using neural networks in their virtual containers. I guess I’ll have to do some deep learning to figure out the best approach.
Rather than thinking of them as attacks, I like the term “Internet Background Radiation” to describe the random probes and connection attempts. Maybe wait for a second or third connection attempt before you classify it as an attack. Very cool project!
Thats actually not a bad idea…
Giving one’s PC cancer.
Hmm, nice one with ocean mapped resolution too array allowing you to point down a hack attempt from east indian ocean where MH 370 went down/ditched to off load $4B worth of diamonds and gold laundered from previous malaysian prime minister…
Just connect it to automatic rocket launcher to shot any hackers.
I’m sorry – but I don’t understand what’s going on here…
1. Are you saying the ESP8266 is connected to a full-up PC which is serving something up, then sniffing visitor IP addresses in Python with Scapy, then playing the IP’s against a local downloaded MaxMind geoip database using python-geoip, then sending the location to the ESP8266 which then turns on the appropriate map light?
2. Or is the ESP8266 the whole thing where the ESP is running MicroPython, serves up something, sniffs visitor IP’s with Scapy, plays the IP addresses against an online geoip server with python-geoip which returns the location, then uses the location to turn on the appropriate map light? But AFAIK MaxMind doesn’t serve geoip lookups, they only have a downloadable data base (which costs money).
I think the main problem is that I don’t know how python-geoip works with MaxMind plus i’m not clear if python is running on a PC or on the ESP8266. A block diagram of the setup would put this to rest instantly.
I think it’s inteinteres and complicated too. Ok letsl assume on of my servers are getting a massivm attack from fome APT group somewhere in the world, and I want to secure transfer my data to another location through lan, internet, intranet or whatever. Also I want to do a secure wipe or data destruction and leave no trace do you have a good solution for that??
Hi Drone,
The ESP8266 is just using the WiFi connection to contact a server via an HTTP request and parses the IP location data in the response. The server just has to be reachable and running that python code (in this case, you can use whatever you want as long as you output a file in the same format that the ESP can parse). MaxMind has free databases that you can download, precise enough for this project. If you install the python package python-geoip-geolite2 you don’t have to do anything else as it contains the database. Hope this helps.
the 8266 can easily do ws2812s with bit banging in C – so there is not need to be limited to spefic ports. Indeed, you could have put each strip on it’s own data pin if you had of wanted to..
True, my ambilight clone just uses FastLED and I could use just about any pin.
I really like the aesthetic. I have considered doing that sort of thing before but practicality always seems to win out and I end just using a computer and monitor. Your way is much classier, hole or no hole. You get thumbs-up from me. Well done.